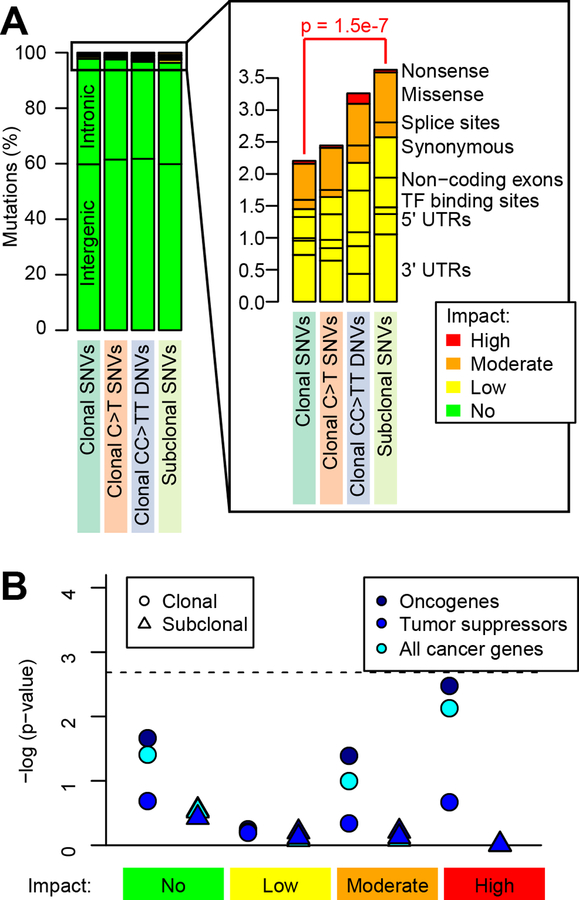
Figure 4: Functional characterization of somatic SNVs and DNVs.
(A) For the four somatic mutation classes, the variants are grouped based on impact determined via SnpEff (Cingolani et al., 2012). P-value shows the enrichment of low impact mutations in subclonal SNVs compared with clonal SNVs (Fisher’s exact test). (B) Enrichment analysis for clonal (the union of the three classes of clonal variants) and subclonal variants in cancer genes. The horizontal dashed line shows the p-value threshold of significance for Bonferroni correction (FDR < 0.2). See also Table S6, Table S7.

