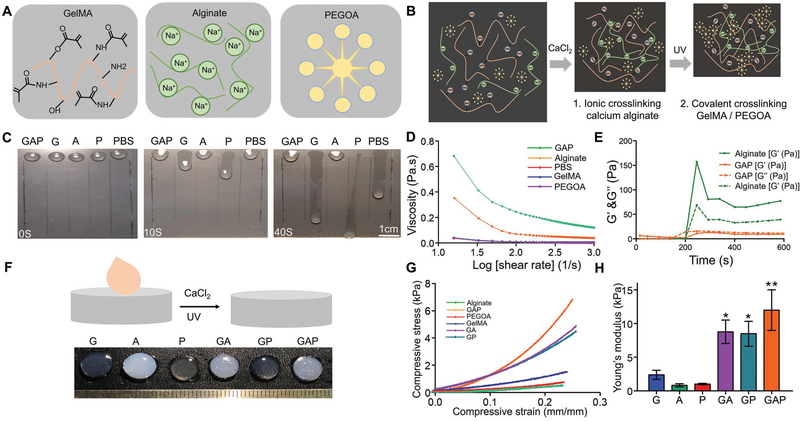
Figure 1.
Optimization of the bioink. A) Schematic structures of GelMA, alginate, and PEGOA. B) Schematic depiction of formation of the GAP hydrogel via crosslinking with CaCl2 and UV exposure. C) Illustration of viscosity of hydrogels on a slope surface (scale bar, 1 cm). D) Influence of the shear rate on the rheological behavior of the customized bioink and the different components of the bioinks. E) G′ and G″ as a function of time of the bioink and the different components of the bioink. F) Visual inspection of the customized bioink and the different components of the bioink after CaCl2 and UV-light exposure. G) Compressive stress–strain curves for the customized bioink and the different components of the bioink. H) Young’s modulus of the hydrogels determined from the stress–strain curves. G: 7% GelMA; A: 2% alginate; P: 2% PEGOA; GA: 7% GelMA and 2% alginate; GP: 7% GelMA and 2% PEGOA; GAP: 7% GelMA, 2% alginate, and 2% PEGOA.

