Fig. 2.
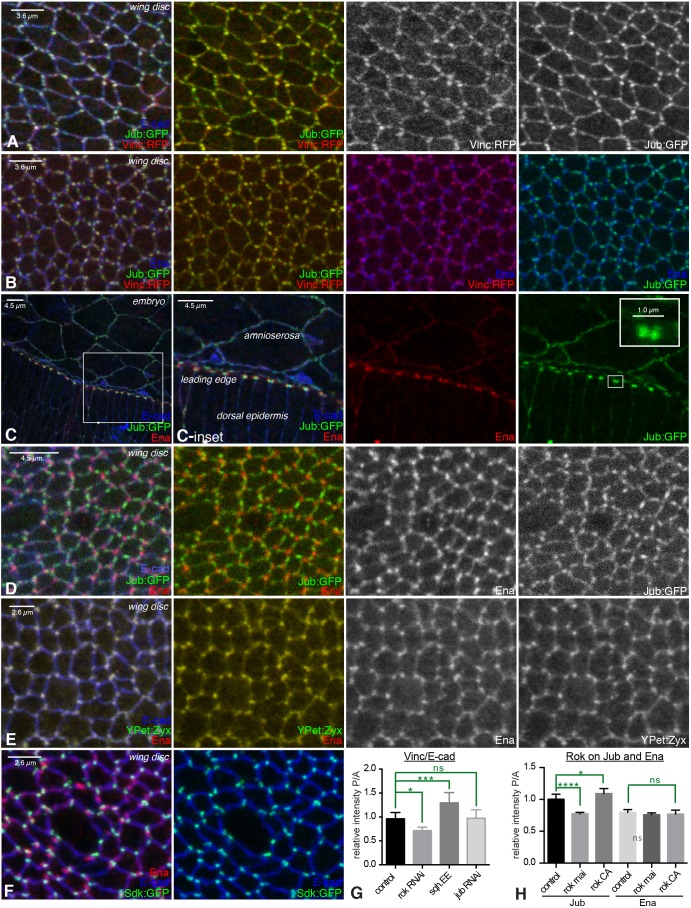
Colocalization of AJ complex proteins. (A–F) Examination of colocalization amongst proteins in AJ complexes, with AJs marked by E-cad (blue). Portions of wing discs are shown in A, B and D–F; C shows the leading edge during dorsal closure. (A) Jub:GFP (green/white) overlaps Vinc:RFP (red/white). (B) Jub:GFP (green) and Vinc:RFP (red) overlap each other, but do not overlap Ena (blue). (C) Ena (red) puncta are adjacent to Jub (green) puncta in leading-edge cells; Jub puncta are closer to leading-edge cell–cell junctions. Insets show higher-magnification views of the boxed regions. (D) Jub (green/white) puncta do not overlap Ena (red/white) puncta. (E) Ena (red/white) puncta overlap YPet:Zyx (green/white) puncta. (F) Sdk:GFP (green) overlaps E-cad (blue) but not Ena (red). (G) Quantification of the relative junctional intensity of Vinc, normalized to E-cad intensity, in posterior (P) versus anterior (A) cells in wing discs expressing control UAS line (n=14), UAS-Rok RNAi (n=5), UAS-sqh.EE (n=8) or UAS-jub RNAi (n=13) under en-Gal4 control. (H) Quantification of the relative junctional intensity of Jub and Ena, as indicated, in P versus A cells in wing discs expressing control UAS line (n=7), UAS-Rok RNAi (n=14) or UAS-Rok.CA (n=6) under en-Gal4 control. For G and H, significant differences from control are indicated. ns, not significant; P>0.05; *P≤0.05, ***P≤0.001, ****P≤0.0001. Error bars indicate 95% c.i.

