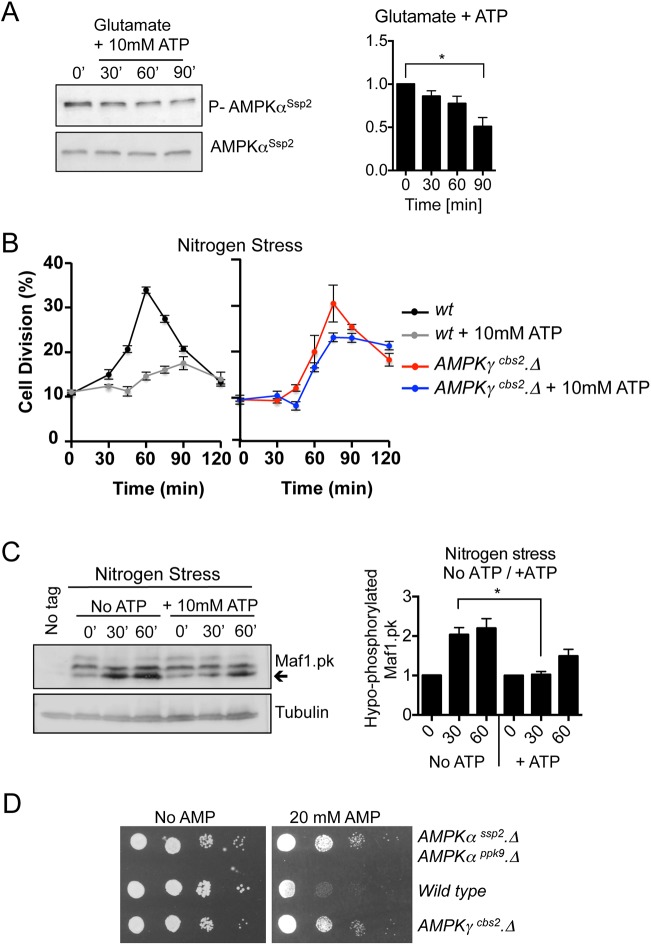
Fig. 2.
ATP alters nutrient stress-invoked mitotic advancement via AMPK. (A) Western blot analysis of AMPKαSsp2 activating T-loop phosphorylation. Early exponential prototroph wt cells were grown in EMMG and 10 mM ATP was added. Samples were taken at the indicated time points (′ indicates minutes). n=3. (B) Early exponential prototroph wt and AMPKγcbs2.Δ cells were grown in EMMG, and then filtered into EMMP to induce nitrogen stress, with and without the addition of 10 mM ATP. Samples were taken at the indicated time points to calculate the proportion of dividing cells. The graphs show the mean±s.e.m. proportion of dividing cells (%). n=3. (C) Western blot analysis of Maf1 phosphorylation. Early exponential prototroph wt cells, which have PK-tagged Maf1 (Du et al., 2012), were grown in EMMG and filtered into EMMP to induce nitrogen stress, with and without the addition of 10 mM ATP. Samples were taken at the indicated time points. Arrow highlights hypo-phosphorylated Maf1-PK. The quantification of the blots on the right shows mean±s.e.m. n=3. (D) Cell sensitivity growth assay. Early exponential prototrophic wt, cbs2.Δ and ssp2.Δ ppk9.Δ double-mutant cells, grown in EMMG. A 10-fold dilution series of each culture was spotted onto EMMG with or without 20 mM AMP. *P≤0.05 (two-tailed Student's t-test).

