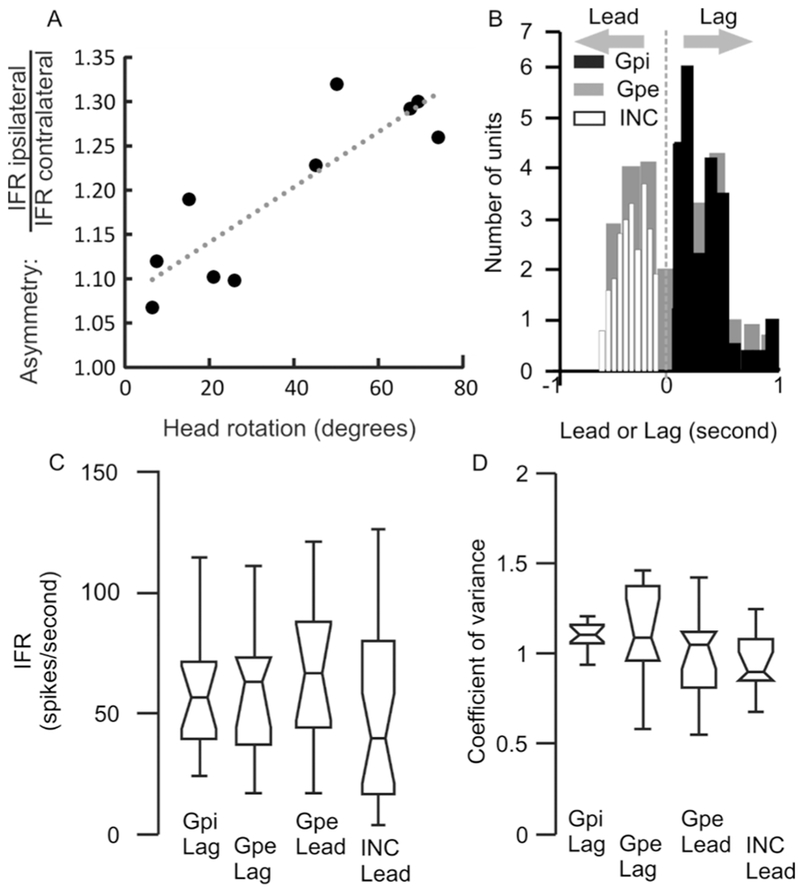
Fig 5:

(A) Correlation of interhemispheric differences in the instantaneous firing rate and angle of head rotation in yaw plane. Each symbol depicts one cervical dystonia patient, while dashed line is an equality. (B) Summary of latency between neural activity and the electromyogrpahic activity. The value of latency is plotted on the x-axis. The negative values depict lead neurons while positive values are lag neurons. All INC cells have lead response, all GPi cells are lag neurons, while GPe has mixture of lead or lag neurons. (C,D) Box and whisker plot depicting instantaneous firing rate (C) and the coefficient of variance (A). Horizontal line in the center shows the median value, notch is 95% confidence interval, length of the box is the interquartile distance, while length of whisker represents the range.
