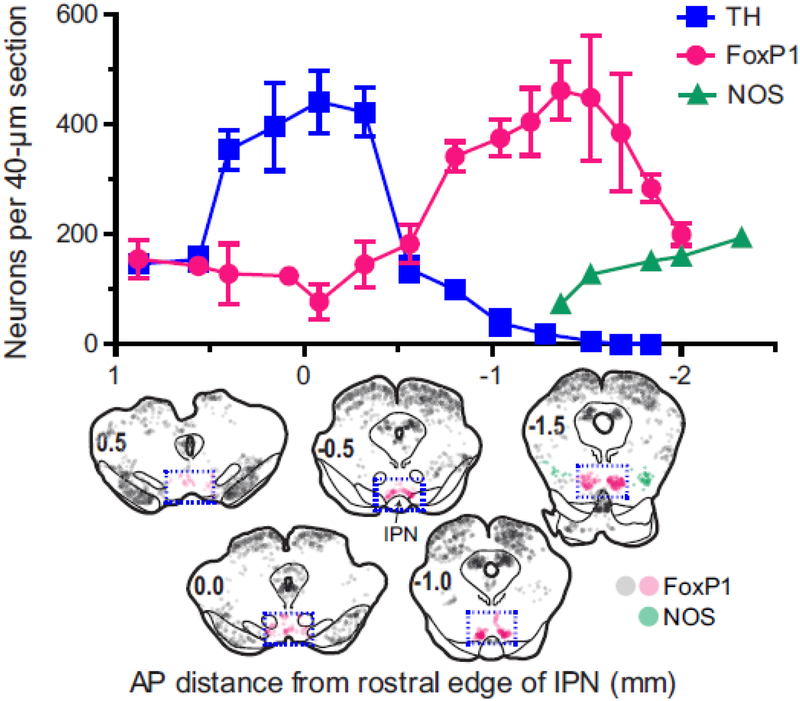
Fig. 2.
Distribution of FoxP1 neurons across the rostrocaudal axis of the ventral midbrain, as compared to the distribution of dopamine (TH-expressing) and PPTg acetylcholine (NOS-expressing) neurons in rats. Graph shows number of neurons immunoreactive for FoxP1, TH, and NOS in 40-μm coronal sections at specific anterior-posterior (AP) distances based on the rostral edge of the interpeduncular nucleus (IPN). Corresponding AP distances based on bregma would be: −5.0, −5.5, −6.0, −6.5, and −7.0. Brain sections show distribution of FoxP1 and NOS neurons at representative AP levels. FoxP1 and TH neurons were counted within the blue rectangular dashed outline; NOS neurons were counted outside the rectangular outline.

