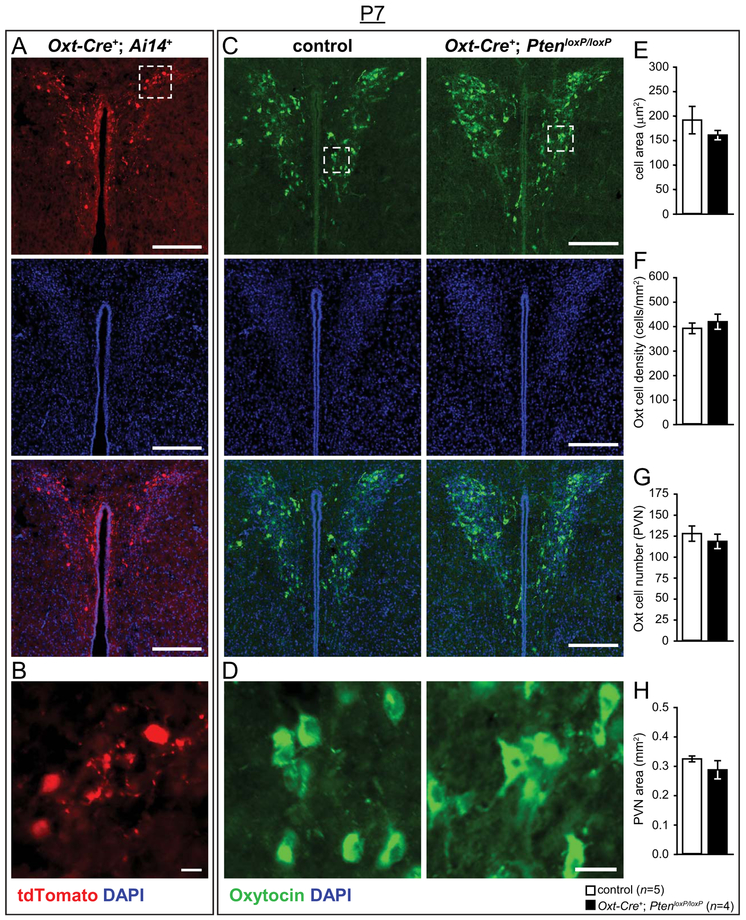
Figure 6.
Neuroanatomical analysis of Oxt immunoreactive cells at post-natal day 7 (P7) in the PVN of Oxt-Cre+; PtenloxP mice. (A,B) Representative images of control (Oxt-Cre+; Ai14+) and Oxt-Cre+; PtenloxP/loxP; Ai14+ PVN (A) with tdTomato (red) expressed in cells in which Oxt-Cre has been active, stained with DAPI (blue), and enlargements showing cellular resolution (white square, B). (C,D) Representative images of control and Oxt-Cre+; PtenloxP/loxP PVN (C) immunostained with anti-Oxt (green) and DAPI (blue), with enlargements showing cellular resolution (white square, D). (E–H) Normal Oxt cell soma area (E), Oxt cell density (F), Oxt cell number (G), and PVN size (H) in P7 Oxt-Cre+; PtenloxP/loxP mice. Scale bars: 200 μm (A,C), 20 μm (B,D).

