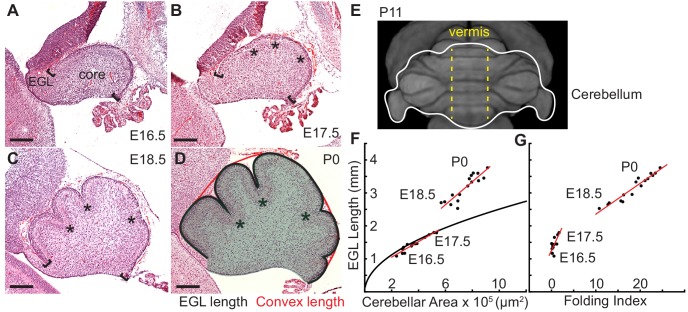
Figure 1. Initiation of cerebellar folding correlates with timing of differential expansion.
(A–D), H and E stained midline sagittal sections of FVB/N mice at the indicated embryonic (E) and postnatal days (P). Anterior to the left. Stars: ACs. Brackets: anterior/posterior ends of the EGL. Black line and red line in (D): EGL and convex length, respectively. Shaded area: core. (E) manganese enhanced magnetic resonance imaging of P11 cerebellum outlined in white adapted from Szulc et al. (2015). Anterior to the top. Vermis indicated by dotted yellow lines. (F), At E16.5 and E17.5 expansion of EGL length and cerebellar area fit the proportional expansion of a semi-circle (curve). At E18.5 and P0 EGL expansion is greater than core area growth creating differential expansion. (G), Folding index [1 - (convex length/EGL length) x 100] reveals folding initiates during differential expansion. Scale bars: 200 μm.

