. 2019 Apr 16;8:e45019. doi: 10.7554/eLife.45019

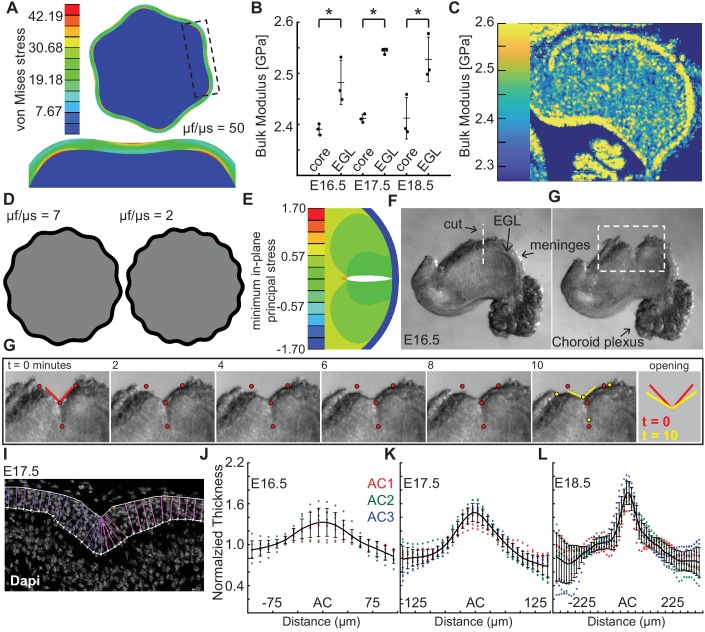
Figure 2. Measured tissue stiffness, stress, and shape at folding initiation are inconsistent with wrinkling models.

(A), Inducing the correct number of folds through a wrinkling model requires a stiffness differential between the layers of 50 fold (μf/μs = 50, g = 1.05). (B,C) Acoustic mapping of cerebellar slices show a slightly stiffer EGL than core at each stage (anova df = 5; p=1.0e−4, F = 13.59), but not the required differential. Stars indicate statistical differences. (D) Wrinkling simulations constrained by developmental data produce wavelengths inconsistent with the embryonic mouse cerebellum. (E) Elastic simulations predict the EGL remains closed after cutting. (F,G) Images of a live cerebellar slice before and after cutting, and images from time lapse movie, (H) show the EGL opens, revealing circumferential tension along the EGL. Red and yellow dots: cut edges. Lines: relaxation angle. (I) Staining of nuclei with EGL outlined and lines used to measure thickness. (J–L) Normalized EGL thickness (thickness/mean thickness) at the ACs increases during folding initiation (anova E16.5 df = 29, p=8.2e−20, F = 12.59. E17.5 df = 29, p=3.4e−116, F = 62.78, E18.5 df = 57, p=6.8e−67, F = 13.28). At E16.5 only brains with visible ACs were included. Error bars: S.D.

Figure 2.

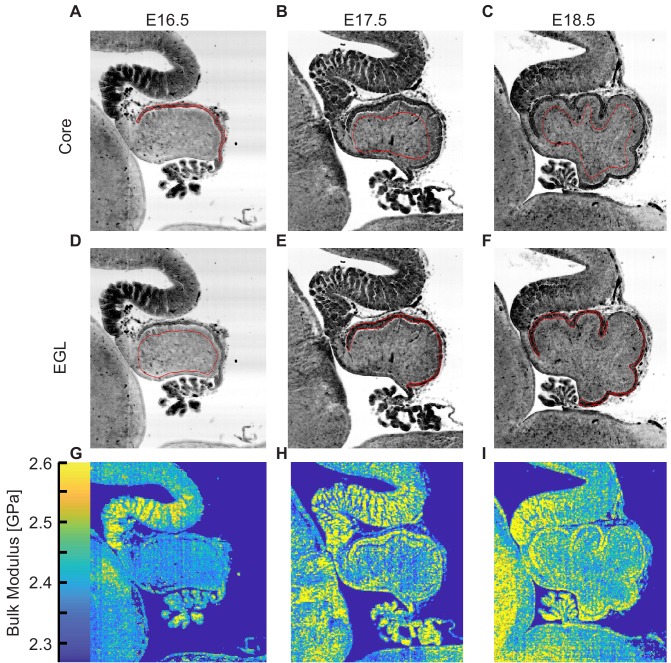
Figure 2—figure supplement 1. Examples of the regions measured regions by acoustic microscopy.

Figure 2—figure supplement 1.

(A–F) Examples of the Region of Interest (ROI) measured for each for core and EGL. (H–J), Representative bulk modulus maps.
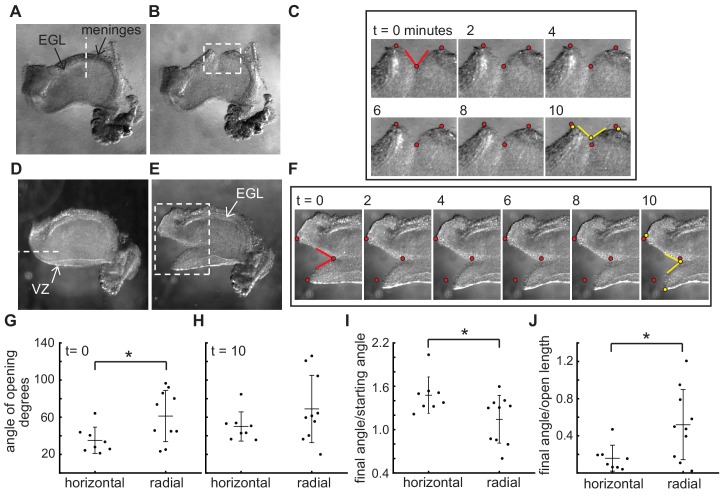
Figure 2—figure supplement 2. The stress patterns within the cerebellum are different between the EGL and the VZ.

Figure 2—figure supplement 2.

(A–C), Example of a live cerebellar slice before (A) and after (B) a radial cut through the EGL, and still images from a time-lapse (C). Time = 0 min is at the time it takes to remove the knife and start the imaging, therefore the cut has already begun opening. (D–F) Example of a live cerebellar slice before (D) and after (E) a horizontal cut through between the EGL and ventricular zone (VZ), and still images from a movie (F). (G–I) radial cuts through the EGL open more quickly initially than horizontal cuts between the EGL and the Ventricular zone, but the latter continue to relax for longer ((G) f-test for unequal variance p=0.09, two tailed t-test df = 16, p=0.03, T = −2.43; (H) f-test p=0.04 and unequal variance two-tailed t-test df = 12.8 P=0.16, T = −1.48; (I) f-test p=0.49 and two tailed t-test df = 16, p=0.03, T = 2.43). (J) The degree of opening is tightly related to the length of the opening in horizontal cuts but not in radial cuts (f-test p=0.02, unequal variance two tailed t-test df = 11.89, p=0.02, T = −2.80). Stars: statistical differences. Error bars: S.D.
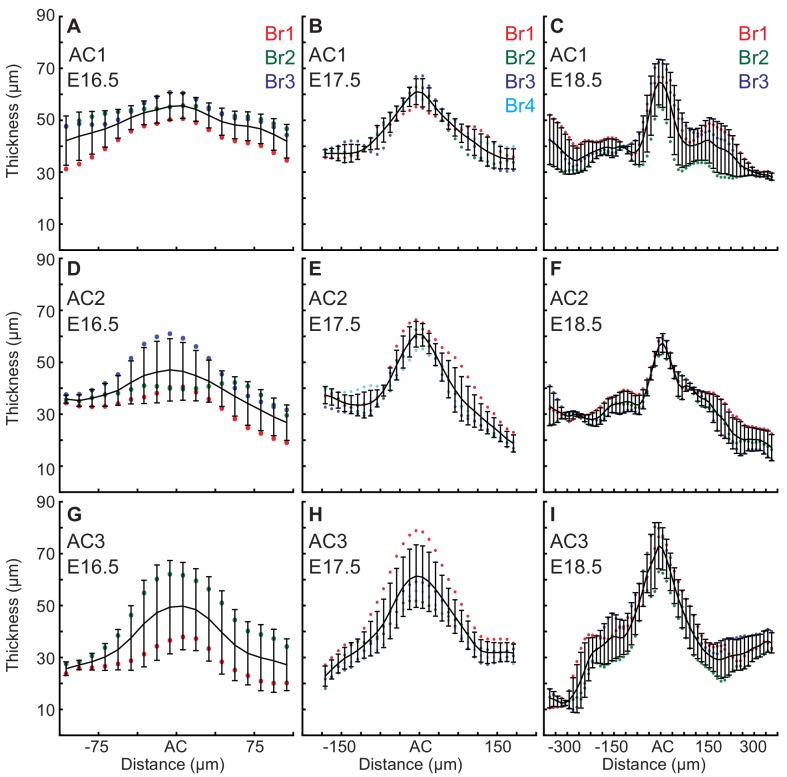
Figure 2—figure supplement 3. EGL thickness increases in the ACs during the initiation of folding.

Figure 2—figure supplement 3.

Only E16.5 cerebella that showed regional thickening in the geometry where ACs normally arise were used for the measurements, and one embryo did not yet have an AC3. (A–C) Thickness variation in and surrounding AC1 (anova (A) df = 17, p=0.13, F = 1.55 (B) df = 29, p=7.0e−14, F = 6.82 (C) df = 57, p=9.1e−11, F = 4.05). (D–F) Thickness variation in and surrounding AC2 (anova (D) df = 17, p=0.08, F=1.74 (E) df = 29 P=3.9e−22, F = 11.88 (F) df = 57 P=2.9e−35, F = 16.35). (G–I) Thickness variation in and surrounding AC3 (anova (G) df = 17, p=0.59, F=0.89 (H) df = 29, p=2.4e−17, F = 9.81 (I) df = 57, p=7.6e−33, F = 14.57). Error bars are S.D.