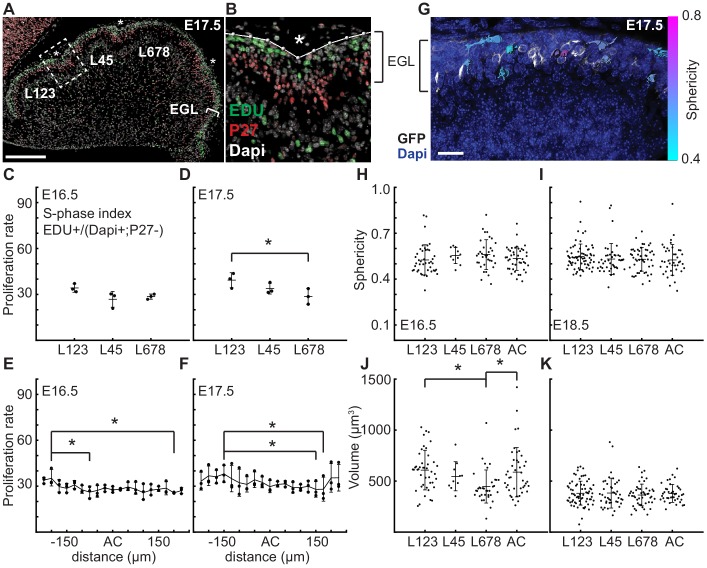
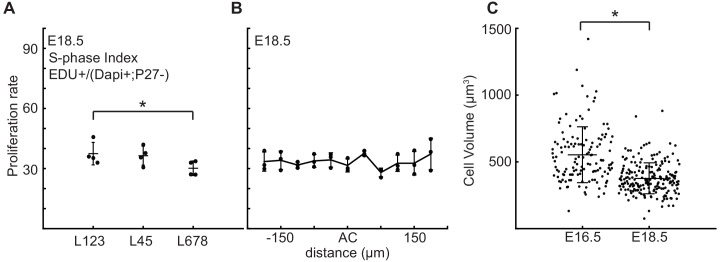
Figure 3. At folding initiation the EGL has uniform proliferation, cell size, and cell shape.
(A,B) Low and high power images of immuno-histochemical (IHC) staining of sagittal cerebellar sections to measure proliferation in the lobules (L) indicated at 25 μm windows surrounding the ACs (stars). Scale bar: 200 μm. (C,D) EGL proliferation rates are shown before and during the onset of invagination (Two-way anova: df = 2. (C) p=0.10, F = 4.36 (D) p=0.03, F = 10.31). (E,F) Proliferation rates are shown in the AC and in the surrounding EGL showing uniformity (Two-way anova: df = 18. (E) p=0.03, F = 2.15 (F) p=2.1e−3, F = 3.06). (G) Section of Atoh1-CreER/+; R26MTMG/+ E16.5 cerebellum showing masked labeled cells. Scale bar: 20 μm. (H,I) Cell shape (sphericity) measurements before and during folding (anova df = 3. (H) p=0.34, F = 1.13 i p=0.61, F = 0.61). (J,K) Cell size measurements before and during folding (anova df = 3. (J) p=3.6e−3, F = 4.75, (K) p=0.85, F = 0.26). Stars indicate statistical differences. Error bars: S.D.


