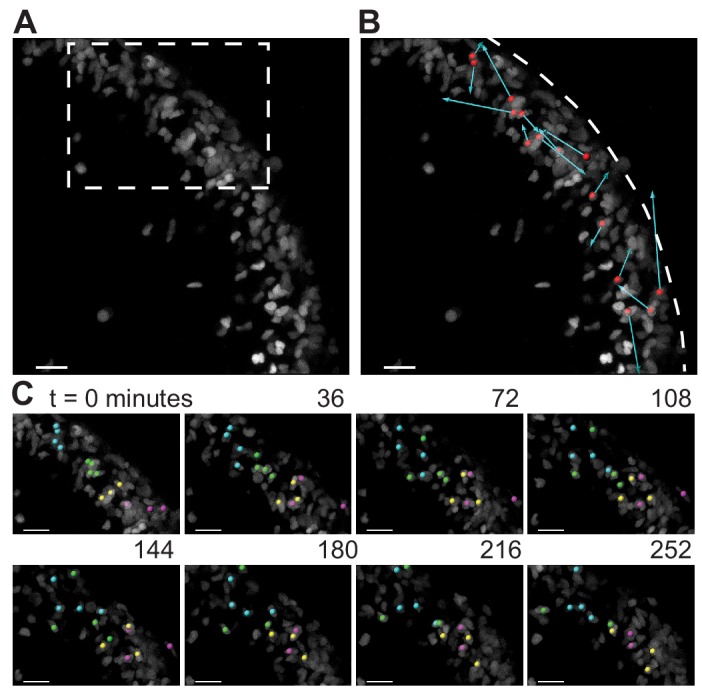
Figure 5. During folding initiation, cells within the EGL are motile and undergo rearrangement.

(A) Image of E16.5 live cerebellar slice (Atoh1-creER/+R26Ai75/+) showing scattered labeling within the EGL. (B) Red dots indicate starting position, displacement arrows show final position of marked cells after 5 hr. White dashed line indicates outer edge of EGL. (C) Still images from time-lapse, inset above. Cells tracked and marked with colored spheres exchange nearest neighbors over a time-scale of tens of minutes. Scale bars are 20 μm.
