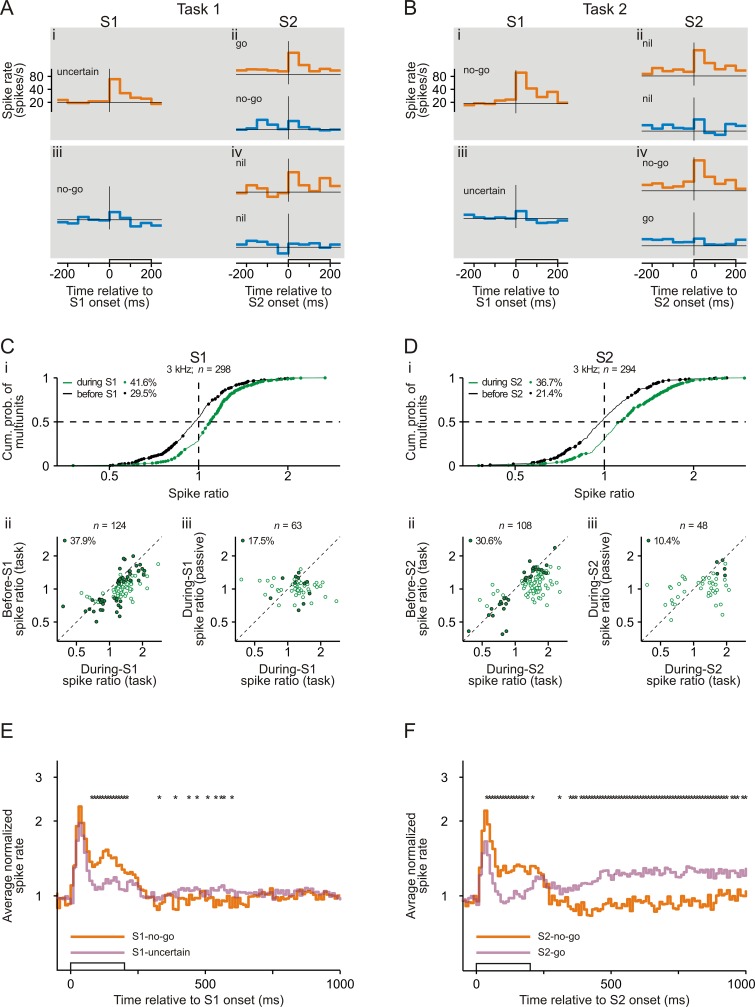
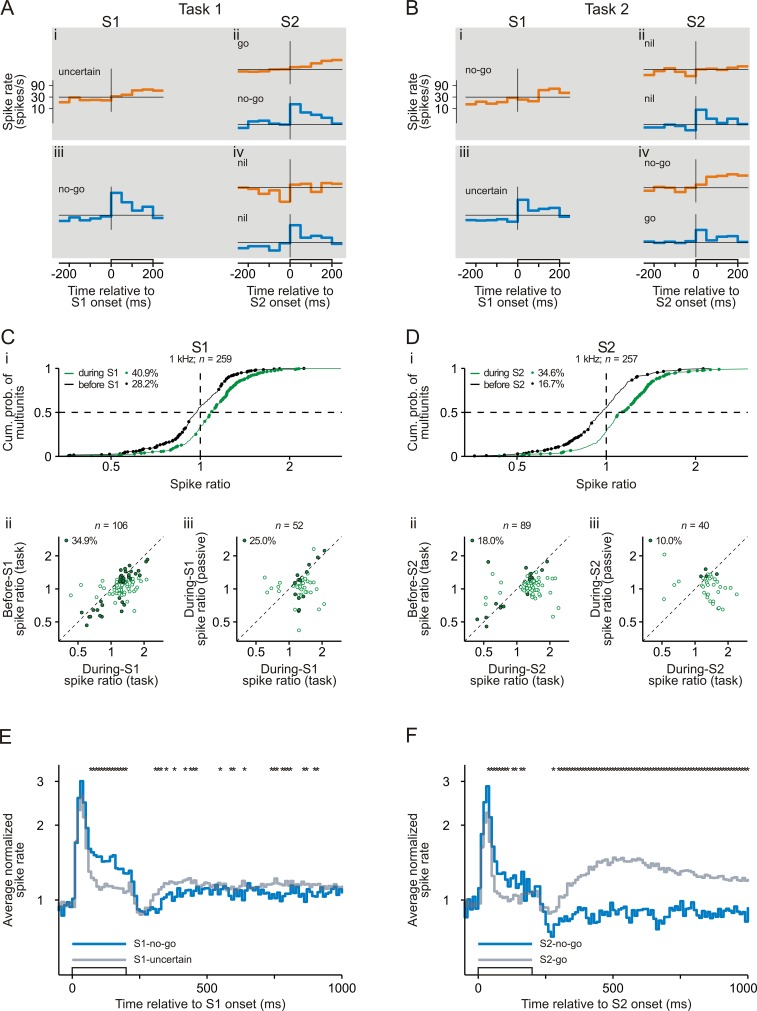
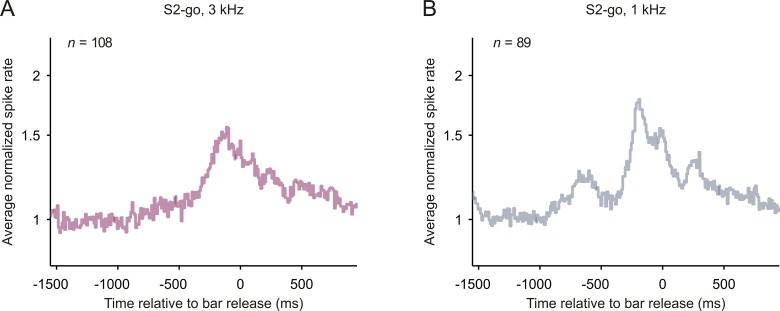
Figure 2. Representation of sensorimotor associations in the spiking activity in early auditory cortex.
(A–B) Spike rates of an example multiunit in auditory cortex to S1 and S2 in Task 1 (A) and Task 2 (B). Orange and blue traces represent spike rates to tones of 3 kHz and of 1 kHz, respectively. Each trace shows the spike rate averaged across trials from 250 ms before tone onset to 50 ms after tone offset. The open bars on the abscissae mark the timing and the 200 ms duration of the tones. The horizontal lines represent a spike rate of 20 spikes/s. Note that the ordinates have logarithmic scaling. The sensorimotor associations of S1s and S2s are also provided. (C) Larger spike responses to S1-no-go than to S1-uncertain when the frequency of the tones was 3 kHz. (i) Cumulative distribution of during-S1 (green) and before-S1 (black) spike ratios for all 298 multiunits recorded from the two monkeys. During-S1 spike ratios were the ratios of the mean spike rates during S1-no-go in Task 2 to the mean spike rates during S1-uncertain in Task 1. Before-S1 spike ratios were the ratios computed from the mean spike rates during the corresponding periods directly before the S1s. Ratios significantly different from 1 are marked by dots, and the proportions of multiunits with such ratios are provided. The horizontal dashed line marks the cumulative probability of 0.5 and the vertical dashed line the ratio of 1. (ii) Larger during-S1 spike ratios than before-S1 spike ratios. The analysis was limited to the 124 multiunits having significant during-S1 spike ratios (green dots in panel i). The open dots mark multiunits with significant during-S1 ratios only and the filled dots mark multiunits with significant during-S1 and before-S1 ratios. The proportion of multiunits with significant during-S1 and before-S1 ratios is provided. The diagonal marks cases where the two ratios were equal. Note that the axes have logarithmic scaling. (iii) Larger during-S1 spike ratios during task performance than in the passive condition. This comparison was limited to the 63 multiunits that exhibited significant during-S1 spike ratios during task performance and that were tested also in the passive condition. The open dots mark multiunits with significant ratios during task performance only and the filled dots mark those with significant ratios both during task performance and in the passive condition. Other conventions are equivalent to those of panel Cii. (D) Larger spike responses to S2-no-go than to S2-go when the frequency of the tones was 3 kHz. The organization of the panel and other conventions are equivalent to those of panel C. During-S2 spike ratios were the ratios of the mean spike rates during S2-no-go in Task 2 to the mean spike rates during S2-go in Task 1. Before-S2 spike ratios were the ratios computed from the mean spike rates during the corresponding periods directly before the S2s. (E) The average normalized spike rates to S1-no-go (orange trace) and S1-uncertain (purple trace) of the 124 multiunits with significant during-S1 spike ratios for the 3 kHz tone, shown from 50 ms before S1 onset to 800 ms after S1 offset. They were obtained by geometrically averaging the spike rates after normalizing each rate to baseline (the mean spike rate during the 250 ms period directly before S1). Note the logarithmic scaling of the ordinate. The stars above the traces mark a significant difference (p<0.05) between the two traces. (F) The average normalized spike rates to S2-no-go (orange trace) and to S2-go (purple trace) of the 108 multiunits with significant during-S2 spike ratios for the 3 kHz tone. Other conventions are equivalent to those of panel E.

