. 2019 Apr 4;8:e43281. doi: 10.7554/eLife.43281

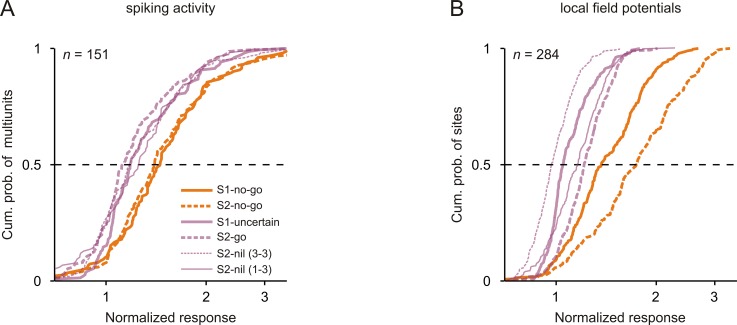
Figure 3. Neuronal responses were strongest to tones that signaled the no-go response.

Cumulative distributions of the normalized neuronal responses to the 3 kHz tone in the six conditions (different sensorimotor associations and positions) for spiking activity (A) and local field potentials (B). For each tone, the normalized neuronal response was calculated as the mean activity during the 250 ms period after tone onset, normalized to the mean activity during the 250 ms period directly before the tone.

Figure 3—source data 1. P values of statistical comparisons of the median spike responses to the tones.
The table shows the p value of each comparison.
DOI: 10.7554/eLife.43281.013
Figure 3—source data 2. P values of statistical comparisons of the median local field potential responses to the tones.
Conventions are equivalent to those of Figure 3—source data 1.
DOI: 10.7554/eLife.43281.014

Figure 3.

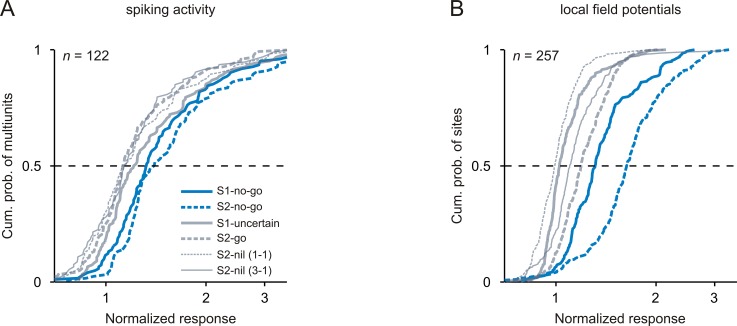
Figure 3—figure supplement 1. Strongest neuronal responses to 1 kHz tones that signaled the no-go response.

Figure 3—figure supplement 1.

The organization of the figure and all other conventions are identical to those of Figure 3.
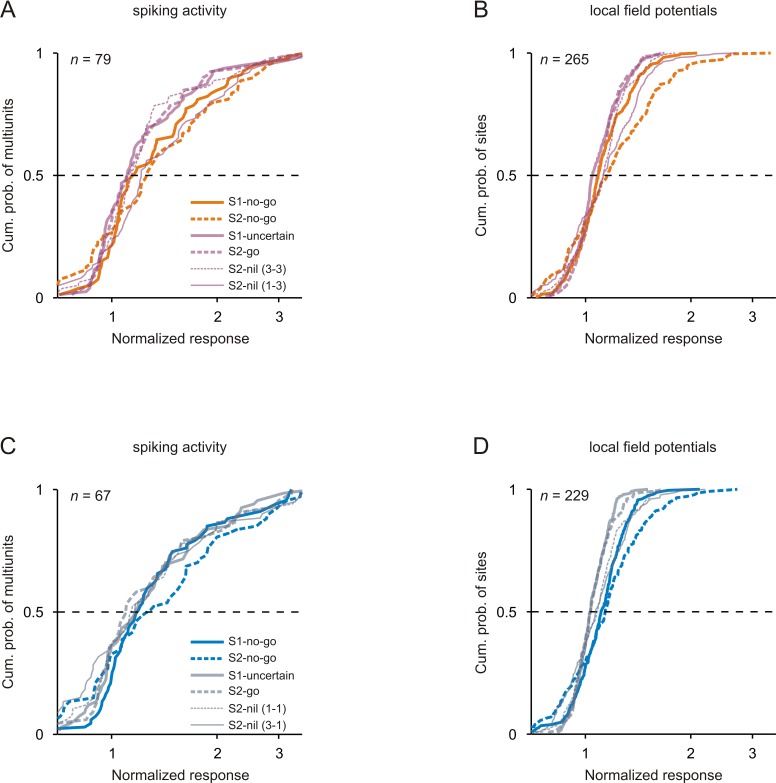
Figure 3—figure supplement 2. Comparison of neuronal responses to tones of the same frequency in the passive condition.

Figure 3—figure supplement 2.

Conventions in A-B are equivalent to those of Figure 3 and conventions in C-D equivalent to those of Figure 3—figure supplement 1.