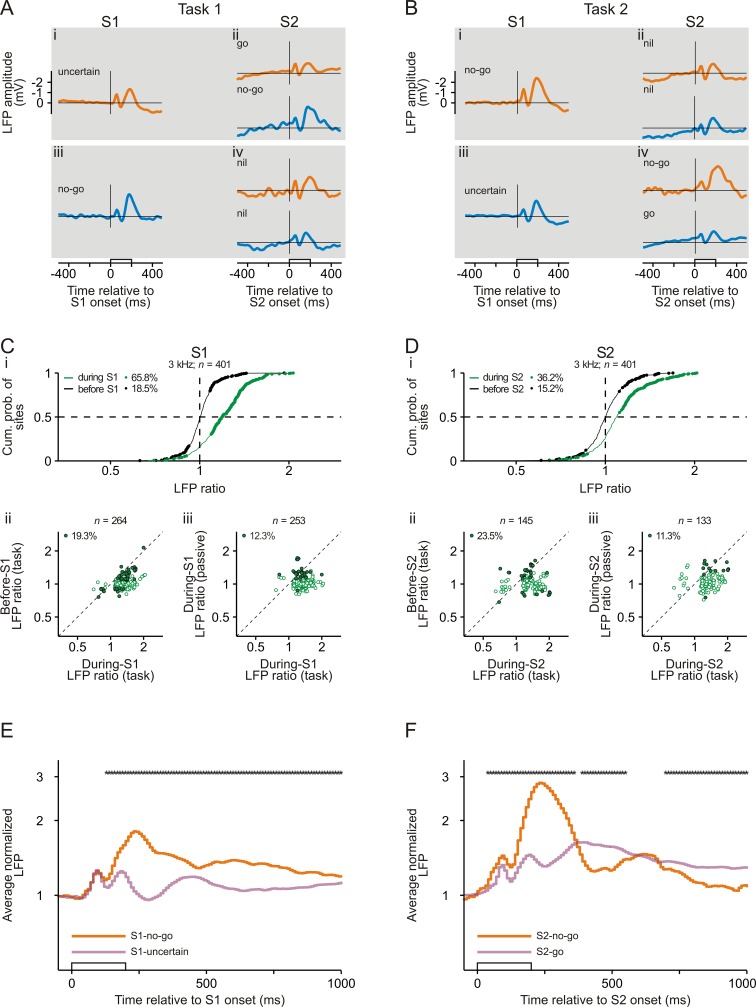
Figure 5. Representation of sensorimotor associations in the local field potentials in early auditory cortex.
(A, B) The averaged local field potentials (LFPs) for an example site in auditory cortex of monkey L while she correctly performed Task 1 (A) and Task 2 (B). The horizontal lines represent an amplitude of 0 mV. Note that the ordinates in panels A and B have linear scaling. The organization of the figure and other conventions are equivalent to those of Figure 2.


