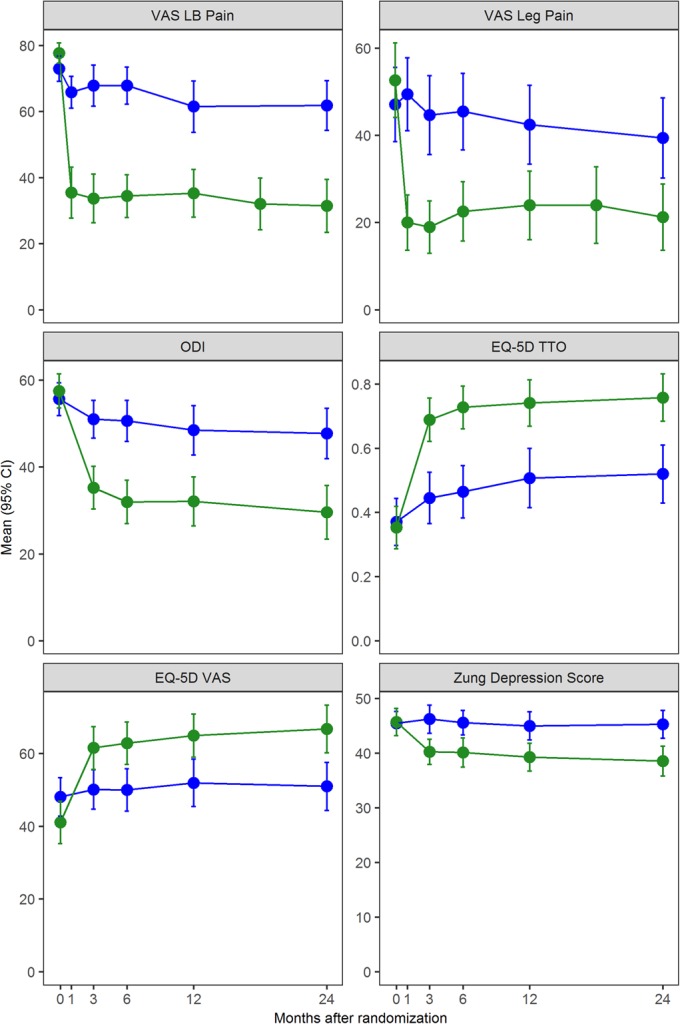
Fig. 2.

Change in VAS low back (LB) pain, VAS leg pain, ODI, EQ-5D time trade-off (TTO), EQ-5D VAS, and Zung Depression Scale scores. Blue indicates the conservative management group, and green indicates the sacroiliac joint arthrodesis group. The last-observation-carried-forward method was used to estimate values after crossover. The values shown are the mean. The error bars indicate the 95% CI.
