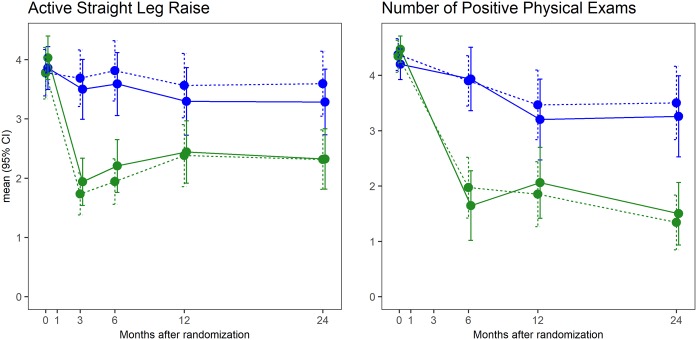
Fig. 3.
Change in functional test (active straight leg raise test) by treatment and time (left) and the number of positive physical examination signs (right). Blue indicates the conservative management group, and green indicates the sacroiliac joint arthrodesis group. The solid line indicates the right sacroiliac joint affected, and the dotted line indicates the left sacroiliac joint affected. The last-observation-carried-forward method was used to estimate values after crossover. The values shown are the mean. The error bars indicate the 95% CI.

