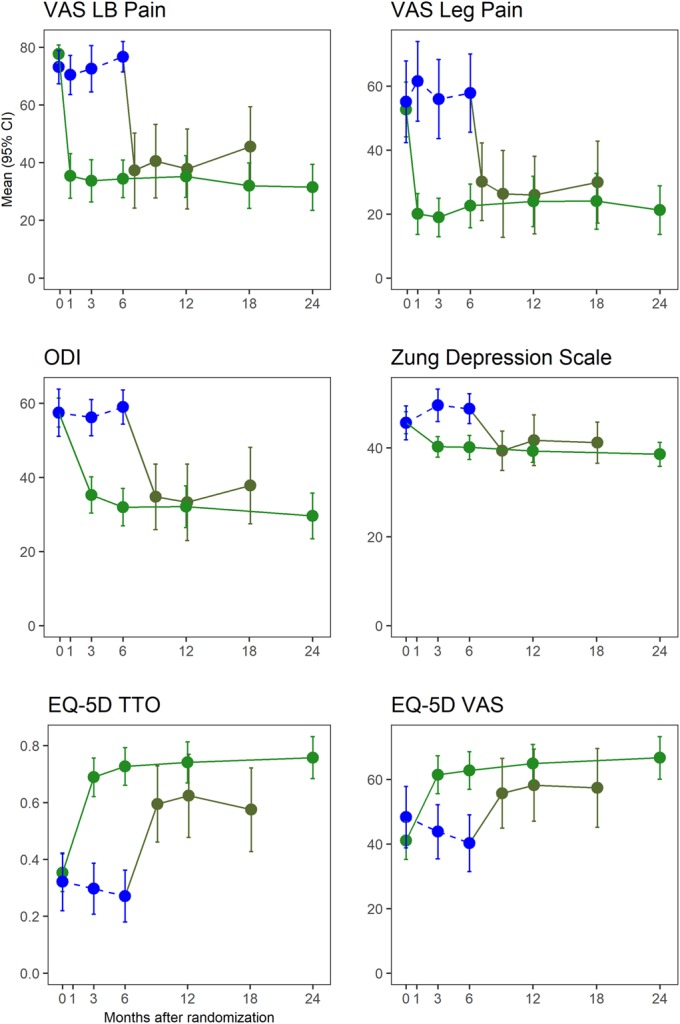
Fig. 6.

Change in VAS low back (LB) pain, VAS leg pain, ODI, Zung Depression Scale, EQ-5D time trade-off (TTO), and EQ-5D VAS scores including subjects who crossed over from conservative management to sacroiliac joint arthrodesis. Green indicates the subjects initially assigned to sacroiliac joint arthrodesis, blue indicates subjects assigned to the conservative management group prior to crossover, and gray indicates conservative management subjects who crossed over to surgical treatment with the sacroiliac joint arthrodesis group after the 6-month visit. The values shown are the mean. The error bars indicate the 95% CI.
