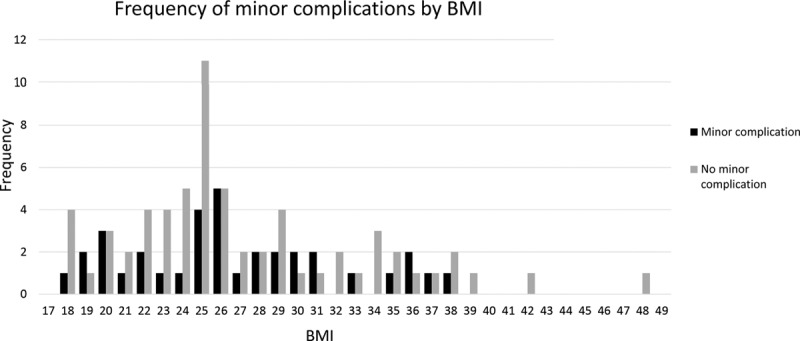
Fig. 4.

Histogram of the frequency of patients with minor complications vs no minor complications by BMI. Black columns indicate the number of patients within each BMI range who experienced a minor complication, whereas gray columns indicate the number of patients who did not.
