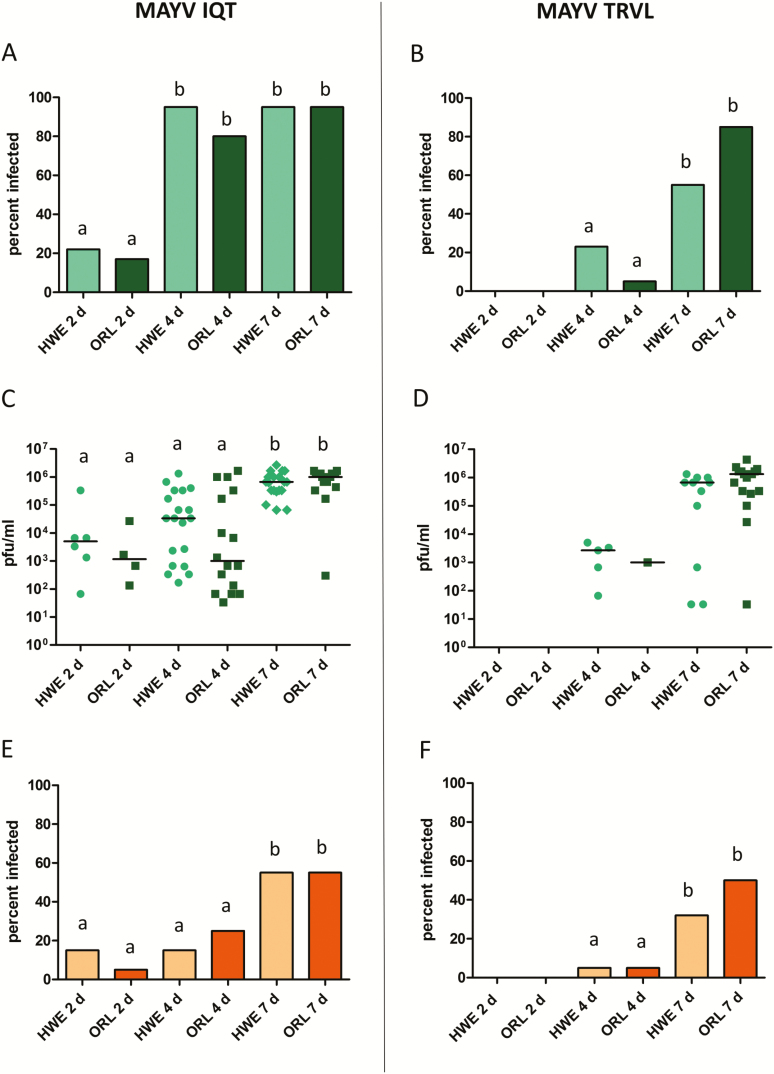
Fig. 4.
Prevalence and intensities of infection of MAYV IQT and TRVL in head tissues of Ae. aegypti HWE and ORL, and prevalence of the viruses in HWE and ORL saliva samples. (A) Prevalence of MAYV IQT and (B) MAYV TRVL infections in head tissues of HWE (n = 20) and ORL (n = 20) mosquitoes at 2, 4, and 7 d pibm. Different letters indicate infection rates that were significantly different from each other as analyzed by Fisher exact test. Significantly different comparisons: P values ranged from 0.0012 to 0.0484. (C) MAYV IQT and (D) MAYV TRVL titers in head tissues of individual HWE (n = 20) and ORL (n = 20) females analyzed at 2, 4, and 7 d pibm by plaque assays in Vero cells. Each data point represents the MAYV titer of an individual head tissue. Only infected mosquitoes were included in the analysis. Black bars indicate medians. Different letters indicate median titers that were significantly different from each other (Mann–Whitney U test). Significantly different comparisons: P values ranged from < 0.0001 to 0.0045. Prevalence of (E) MAYV IQT and (F) MAYV TRVL in saliva samples (n = 20) collected from each mosquito strain at 2, 4, and 7 d pibm. Significantly different comparisons: P values ranged from 0.0033 to 0.0436 (Fisher exact test).

