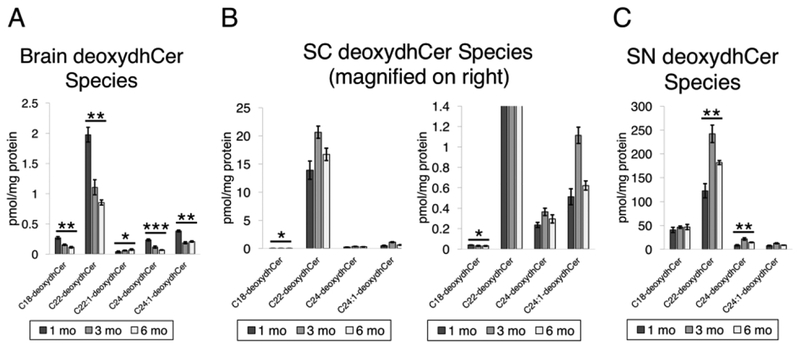
Fig. 6.
DeoxydhCer profile in mouse neural tissue. A) DeoxydhCer species that were measured from brain tissue from 1 month, 3 month, and 6 month mice (P = 0.0015, 0.0017, 0.0423, 0.0008, 0.0023). B) Spinal cord tissue analyzed as in 6A (P = 0.0142, 0.3722, 0.5195, 0.1641). Note multiple panels are presented to show relative levels of all species measured, including C22-deoxydhCer and those that are less prevalent. C) Sciatic nerve analyzed as in 6A (P = 0.3123, 0.0051, 0.0021, 0.1136).

