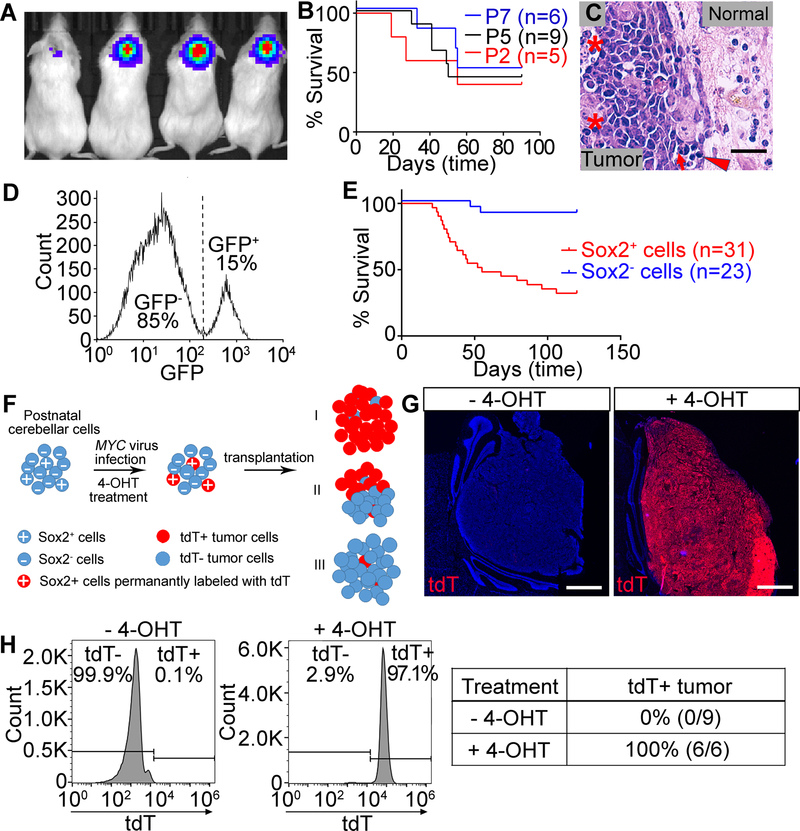
Figure 1. MYC overexpression alone drives tumorigenesis from Sox2+ cells in the postnatal cerebellum.
(A–C) Tumors generated from total cerebellar cells. (A) Bioluminescent imaging. (B) Survival curve. (C) H&E staining of tumor sections. Asterisks show an area of necrosis and a large tumor cell with marked nuclear atypia (anaplasia). Arrow shows prominent nuclear molding. Arrowhead shows mitotic figures. Normal indicates normal tissue. Scale bars = 25 µm. (D) FACS-sorting of Sox2+ cells. (E) Survival curve of tumors generated from Sox2+ or Sox2− cells. (F) Schema for identifying tumor cells-of-origin. (G) tdT expression in tumors generated from Sox2-CreERT2/Rosa-CAG-LSL-tdTomato cells treated with or without 4-OHT. Nuclei were counter-stained with DAPI (blue). Scale bars = 1 mm. (H) Flow cytometry analysis of tdT expression in tumors from (G) and summary of percentage of tdT+ tumors.

