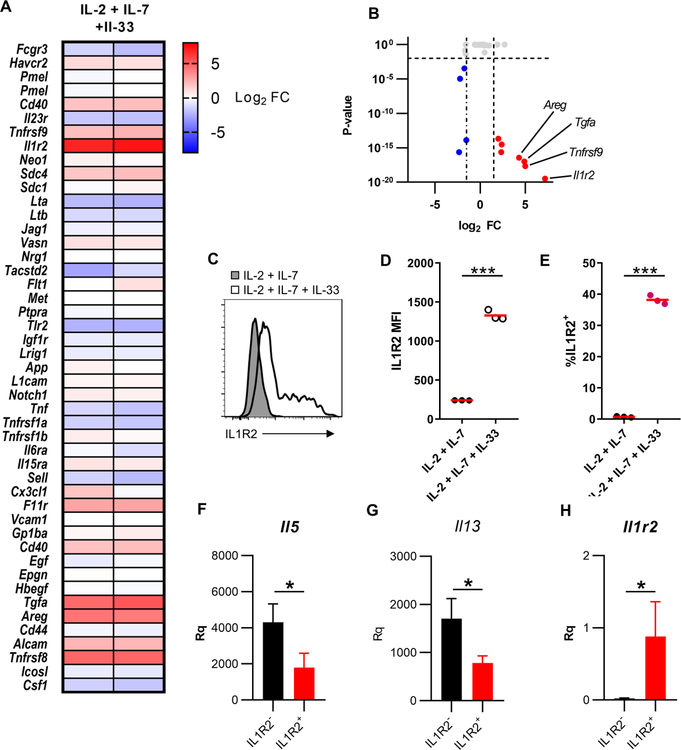
Figure 2: Activated ILC2s express multiple ADAM17 substrates.
(A) Heat map of fold changes from IL-2 + IL-7 + IL-33 stimulated ILC2s vs. IL-2 + IL-7. (B) Volcano plot of genes known to code for ADAM17 substrates. (C) Isolated and expanded ILC2s were cultured with the indicated cytokines and IL1R2 levels were measured by flow cytometry. (D) Statistical quantification of IL1R2 MFI from C. (E) Statistical quantification of % of cells IL1R2+ from C. qRTPCR analysis of (F) Il5 (G) Il13 (H) Il1r2 from IL1R2− and IL1R2+ ILC2s following 3 days of stimulation with IL-2 + IL-7 + IL-33 relative to Tbp and Rrp8. *P < 0.05, ***P < 0.001, Unpaired Student’s t-test (D-E), Mann-Whitney U test (F-H). Data are representative of two (D-E; mean ± s.d.) and one (F-H; mean ± s.d., n=4 per group) independent experiments.

