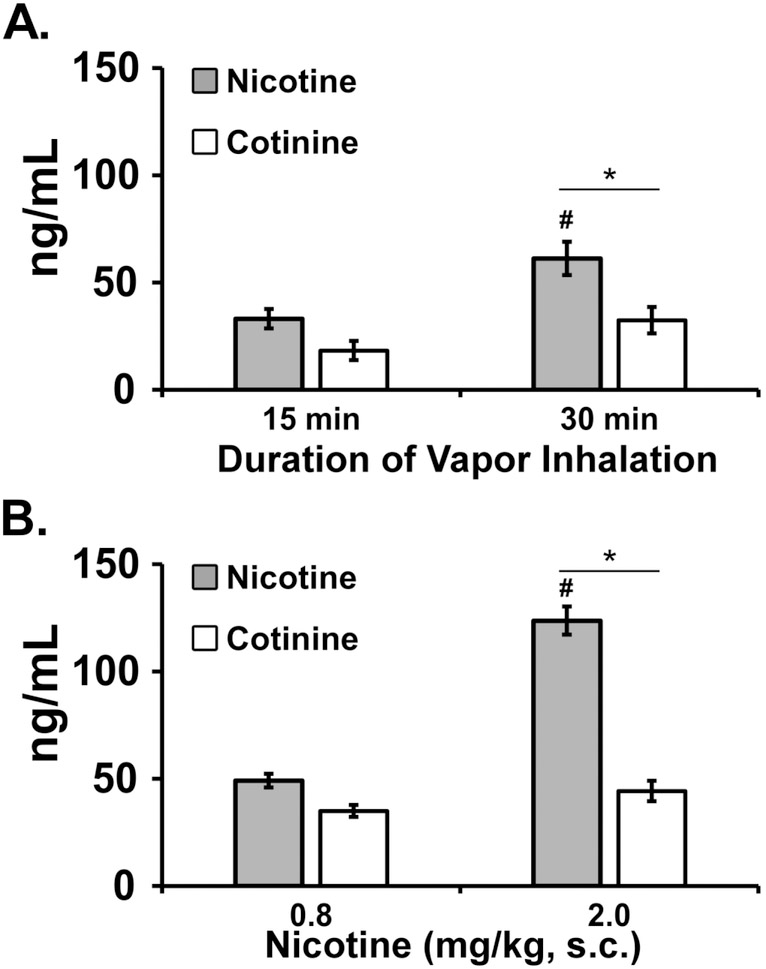
Figure 6:
A) Mean (N=8; ±SEM) plasma nicotine and cotinine concentrations after inhalation of vapor from nicotine (30 mg/mL) after 15 and 30 minute inhalation intervals in the telemeterized S-D rat group at 35 weeks. B) Mean (N=7-8; ±SEM) plasma nicotine and cotinine concentrations in the Sprague-Dawley rats after nicotine injection (0.8, 2.0 mg/kg, s.c.). A significant difference between doses, within analyte is indicated by # and a difference between analytes, within dose, by *.

