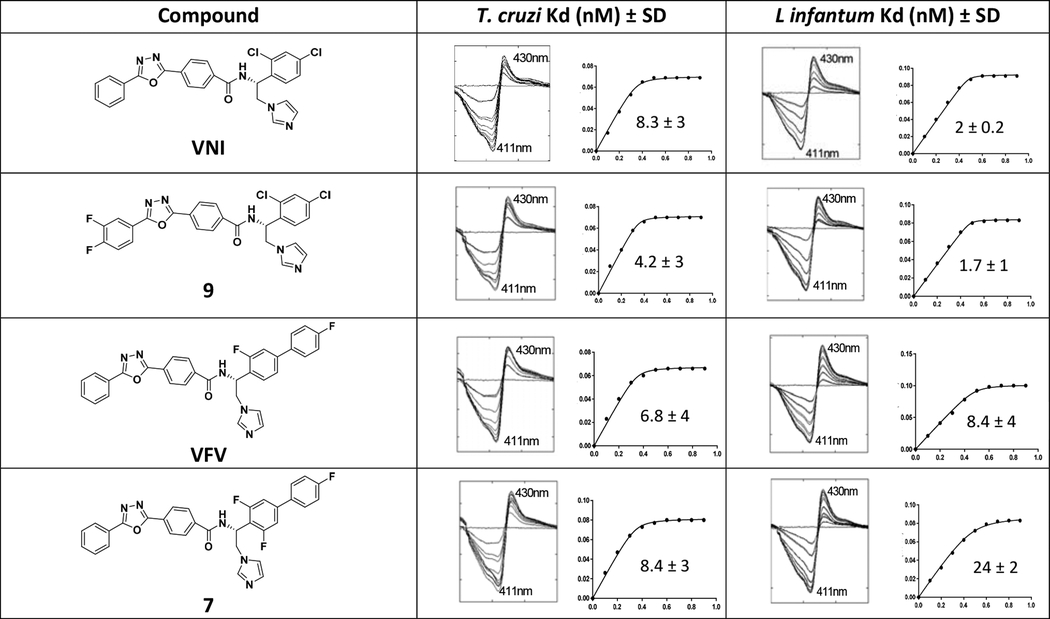
Table 3. Titration of Y-T. cruzi CYP51A and L. infantum CYP51 with Compounds 7 and 9.
VNI and VFV were used as positive controls. CYP51 concentration was 0.5 μM, concentration range of the inhibitors was 0.1–1 μM. Titration curves axes: X, concentration range of the inhibitors (0.1 −1 μM); Y, absorbance changes in the difference spectra Δ(A430-A411).

|
