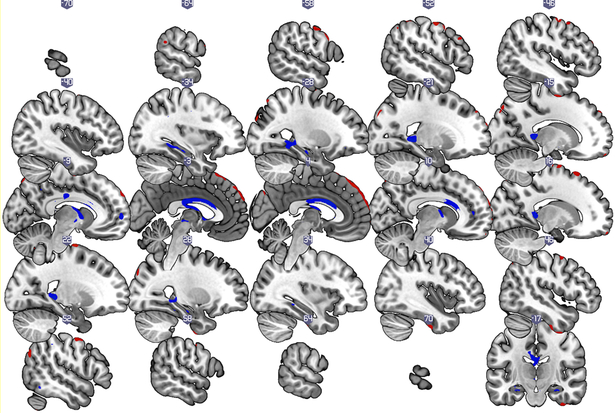
Figure 1b:
Gray matter covariance patterns associated with the SNI-2 score (total number of individuals in a respondent’s social network) in older adults without dementia. Shown are thresholded Z-loadings at |Z|>1.96 p < .05 (.025 in each tail). Positively weighted regions are displayed in blue, implying relatively larger volumes with SNI2-score. Negatively weighted regions are displayed in red, implying relatively smaller volumes with SNI-2 score. All results are adjusted for age, sex, education, total intracranial volume, and global health status.

