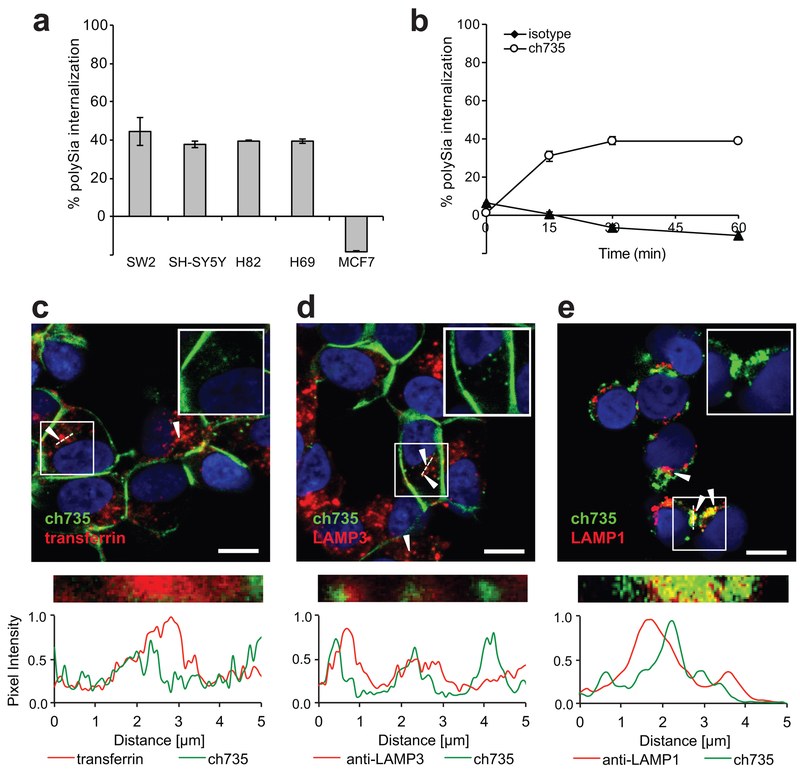
Figure 3. Internalization of ch735 into polySia-positive cancer cells.
(a) Internalization of ch735 in polySia-positive cell lines SH-SY5Y, SW2, H69, and H82, and in polySia-negative MCF7 cells after 1 h. Data are reported as the mean percent internalization and error bars are the standard deviation of the mean (n = 3). (b) Time course of antibody internalization in polySia-positive cell line SH-SY5Y treated with ch735 or isotype control. Data reported as the mean percent internalization and error bars are the standard deviation of the mean (n = 3). (c) Confocal microscopy images of SH-SY5Y cells incubated for 1 h with ch735 labeled with AF488 and transferrin labeled with AF647. Nuclei were stained by Hoescht (blue). Scale bar, 10 μm. Fluorescence intensity was measured across the dotted white line and normalized to the maximum value in each channel. White arrows indicate regions of colocalization. The inset shows only the ch735 (green) and DNA (blue) channels of the boxed region. (d) Confocal microscopy images of SH-SY5Y cells incubated for 1 h with ch735 labeled with AF488 and anti-LAMP-3 labeled with AF647. Nuclei were stained by Hoescht (blue). Scale bar, 10 μm. Fluorescence intensity was measured across the dotted white line and normalized to the maximum value in each channel. White arrows indicate regions of colocalization. The inset show only the ch735 (green) and DNA (blue) channels of the boxed region. (e) Confocal microscopy images of SH-SY5Y cells incubated for 120 min with ch735. Lysosomes were stained with anti-LAMP-1 and A647-labeled anti-rabbit antibody (red), ch735 was stained with AF488-labeled anti-human antibody (green), and nuclei were stained by Hoescht (blue). Scale bar, 10 μm. Fluorescence intensity was measured across the dotted white line and normalized to the maximum value in each channel. White arrows indicate regions of colocalization. The top right inset shows only the ch735 (green) and DNA (blue) channels of the boxed region.

