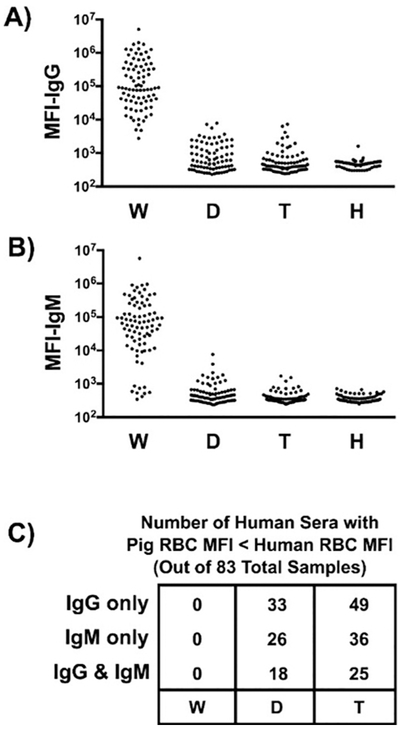
Figure 5: Flow cytometric comparison of human IgG and IgM antibody binding to pig and human RBCs.

Human sera (n=83) were incubated with RBCs isolated from WT pigs (W), or from pigs lacking Gal (i.e., GTKO) and Neu5Gc (i.e., CMAH-KO) (double-knockout, D) or lacking Gal, Neu5Gc, and Sda (i.e., β4GalNT2-KO) (triple-knockout, T). These sera were also mixed with human (allogeneic) RBCs (H) expressing blood group O. Panels A and B show a summary of IgG and IgM binding to various RBCs, respectively. The data represent median fluorescent intensity (MFI). Panel C summarizes the number of samples from panels A and B where the indicated pRBC MFI is less than the MFI for the human blood group O RBCs. (Reproduced with permission from reference [67])
