
Figure 1: Schematic presentation of the various intermediate states connecting the unoccupied and occupied states of the unitary system.
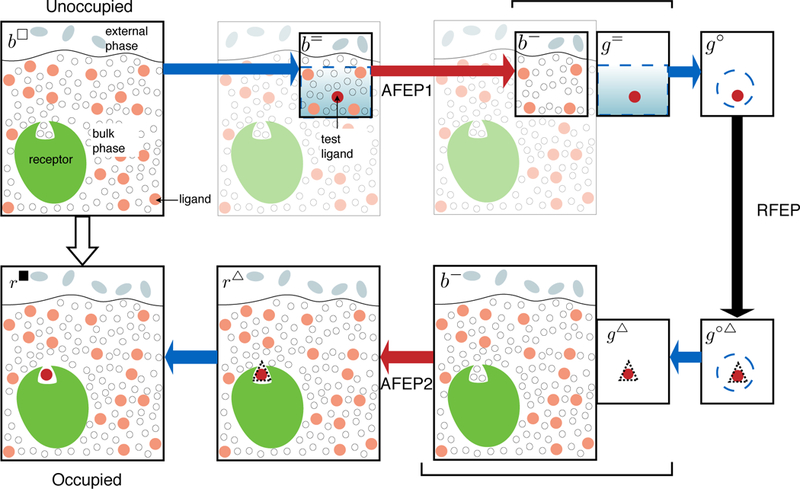
The receptor is green, molecules in the external phase are gray, bulk solvent and ligand molecules are white and pale red circles respectively. The test ligand for decoupling from bulk (AFEP1) and from protein (-AFEP2) is shown as a bright red circle. Blue dashed lines indicate the test ligand is subject to restraints with simple translational geometry, with the shaded gradient indicating possible orientational restraints for highly anisotropic bulk. Black dashed lines indicate the test ligand is under DBC restraints. Systems that are actually simulated are outlined in thicker line, whereas greyed-out components are included in the theory, but omitted from numerical simulations when doing so does not alter the results. Color of arrows represents technique: alchemical free energy perturbation (AFEP, red), restraint free energy perturbation (RFEP, black), analytical (blue). Braces connect pairs of decoupled systems that are sampled simultaneously in alchemical simulations.