
Figure 3.
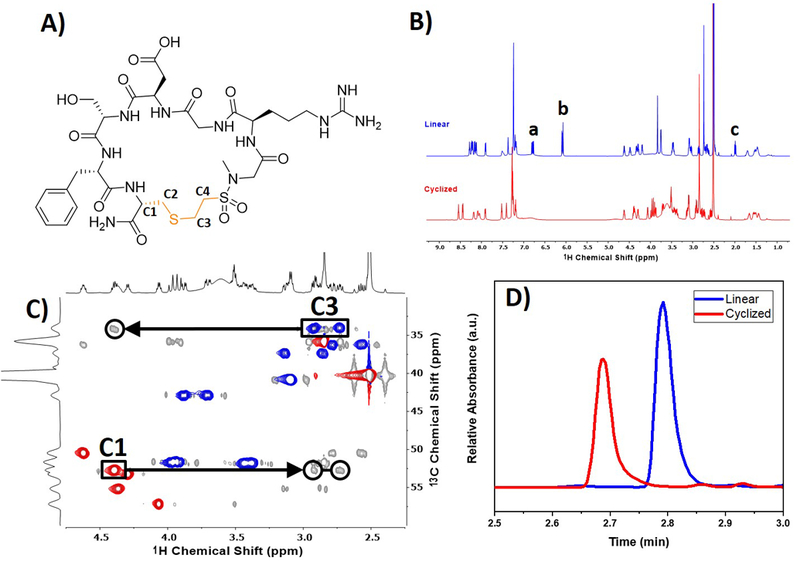
Characterization of macrocyclic RGDS peptide. (A) Structure of the macrocyclized peptide cleaved from the resin with important carbons for confirming macrocyclization numbered C1 through C4. The proton NMR (B) shows the linear peptide in blue and the cyclic peptide in red. Alkenyl protons, denoted by ‘a’ and ‘b,’ disappear after macrocyclization. Additionally, the thiol peak ‘c’ disappears after performing the macrocyclization. An overlay of 1H-13C HSQC (red/blue) and HMBC (grey) is shown in (C) with black arrows highlighting the correlation between the newly formed thioether (C1) and cysteine residue (C3) for the macrocyclized peptide. For the edited 1H-13C HSQC, the blue and red peaks correspond to CH2 or CH/CH3 carbons, respectively. The ESI-UPLC trace shown in (D) of the microcleaved linear and macrocyclized peptides shows a shift in the elution time of the two peptide structures.