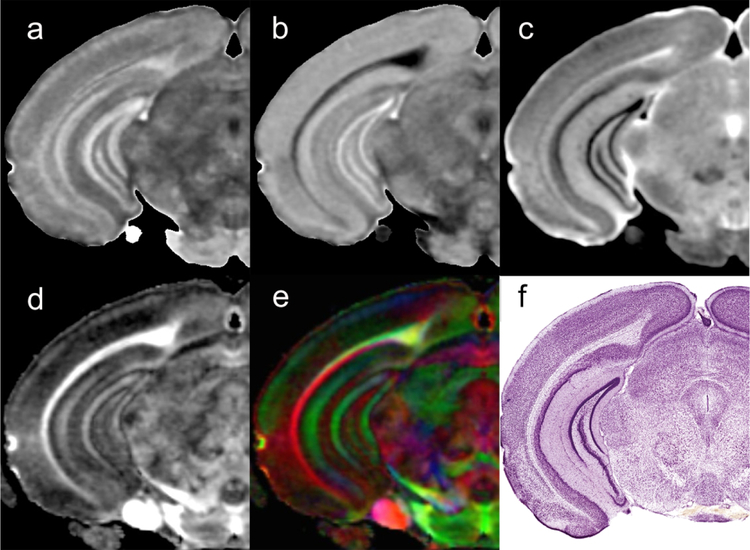
Figure 1.
Scalar images from the Trackvis pipeline are used to drive the registration of the seed labels for the connectome: a) axial diffusivity (AD); b) radial diffusivity(RD); c) mean diffusivity; d) fractional anisotropy (FA); e) color fractional anisotropy (clrFA). For comparison, a histological section stained for Nissl substance (Plate 59 reprinted from (Paxinos and Franklin, 2012) , with permission from Elsevier).

