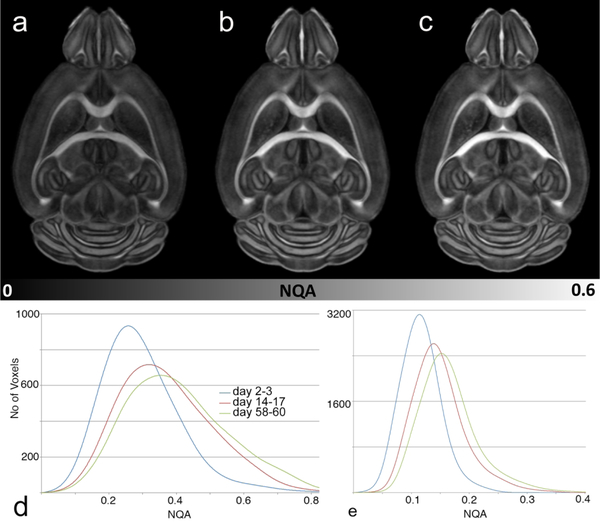
Figure 3.
Fixation and diffusion of the contrast agent induce change in tissue properties. a) NQA image at 2–3 days after perfusion fixation, b) 14–17 days after fixation; c) 58–60 days after fixation show increase of the NQA over time. d) Histogram of all the white matter shows a shift in NQA from day 2–3 to day 14–17 and day 58–60. d) Histogram of NQA in the isocortex demonstrates a shift even in the cortical areas that has profound impact on the resulting tractography.

