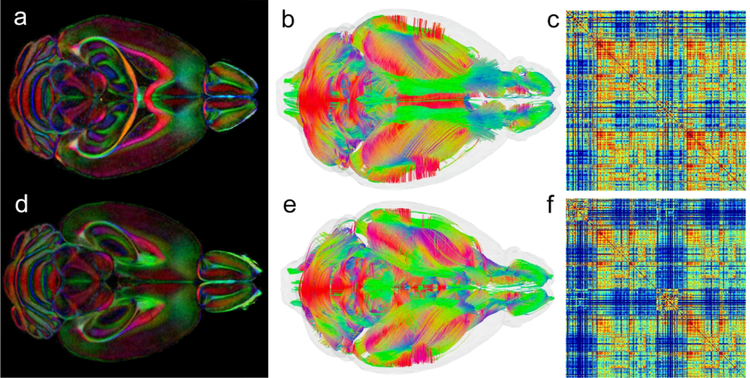
Figure 7.
The whole brain protocol allows one to compare strains with several different perspectives. The comparison of C57BL/6J-top (a) and BTBR-bottom (d) in a dorsal color FA slice shows disruption of the corpus callosum and hippocampal commissure. Comparison of whole brain tractography (b-C57BL/6J and e-BTBR) shows significant global difference in tract organization. Connectome matrices (c-C57BL/6J and f-BTBR) shows quantitative differences in connectivity across the entire brain.

