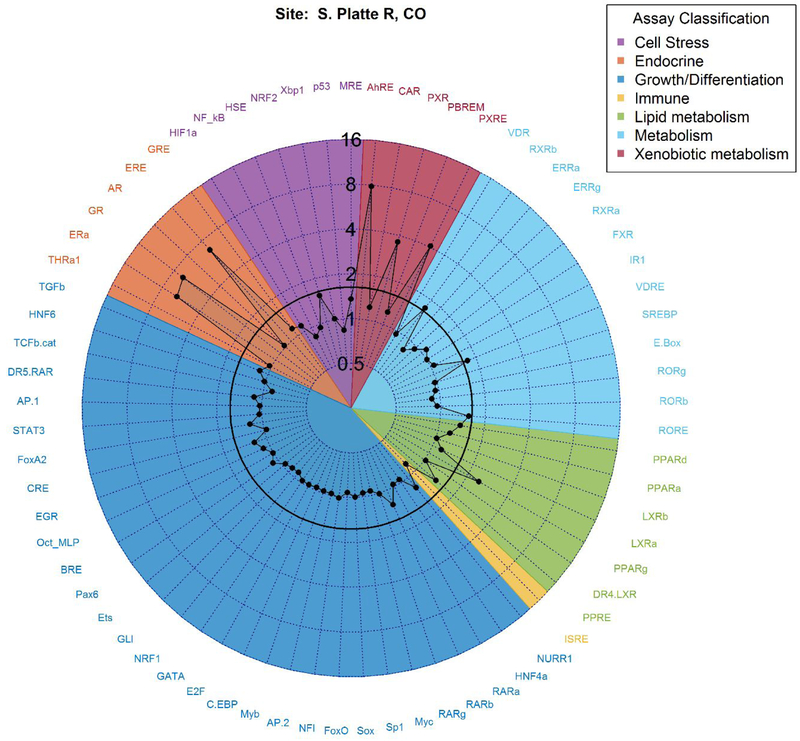
Figure 2.
An example radar plot of blank-normalized area under the curve (AUC) values of both cis_Factorial and trans_Factorial endpoints for the South Platte River, CO site. Assay endpoint names correspond to those in Table S2 and are grouped in colors by general function. The radar axis represents AUC values for each measured endpoint. The activity cutoff value of 1.5 is shown in bold, and activities at or above this value were identified as active.

