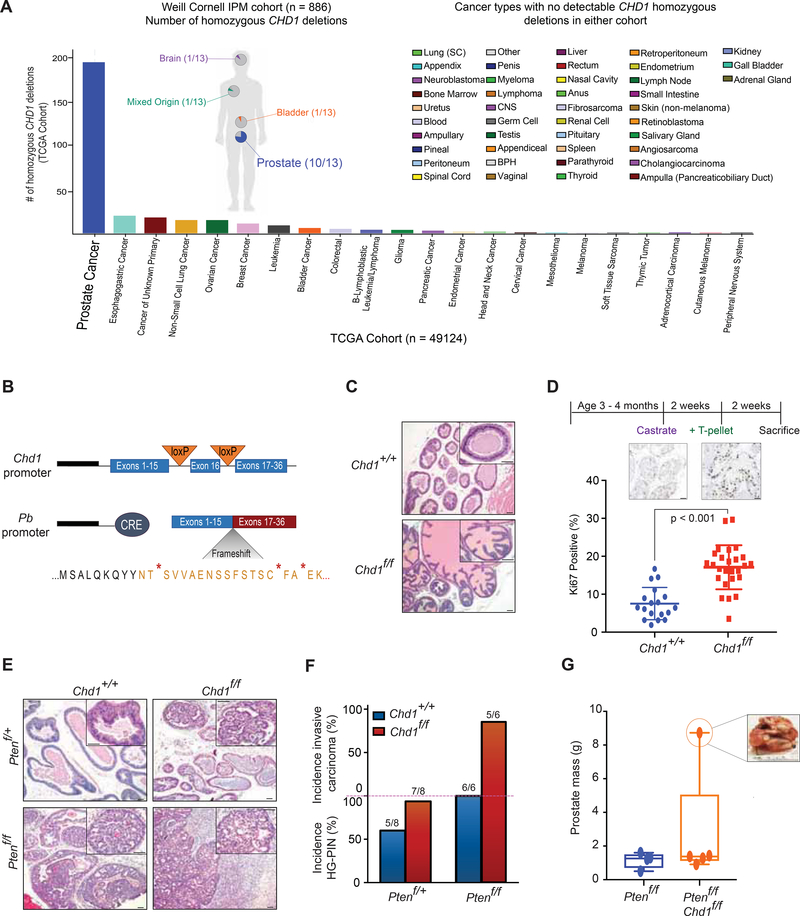
Figure 1.
Genomic loss of Chdl drives progression of prostate carcinoma in vivo. (A) CHD1 homozygous deletions in the TCGA database (The Cancer Genome Atlas Research, 2015) (Histogram) and Weill Cornell Institute for Precision Medicine database (pie charts) for all available samples ((Pauli et al., 2017) and in preparation). (B) Schematic of inducible Chdl knockout in the murine prostate. (C) H&E staining of prostates from Chd1+/+ and Chd1f/f mice in a Pb-Cre background at 1 year (50 μm scalebar). (D) Schematic of castration-testosterone re-supplementation in Chd1+/+ (n = 4) and Chd1f/f (n = 6) mice (top) and quantification of Ki67 staining after testosterone (T-pellet) re-supplementation (bottom) (50 μm scalebar). Data represent +/− SEM. (E) H&E staining of murine prostates at 1 year (50 μm scalebar). (F) Quantification of pathological features per genotype at 1 year. (G) Prostatic mass from 1 year old mice (sum of all lobes). Boxes represent the mean and interquartile range, with min and max values indicated. See also Figure S1.

