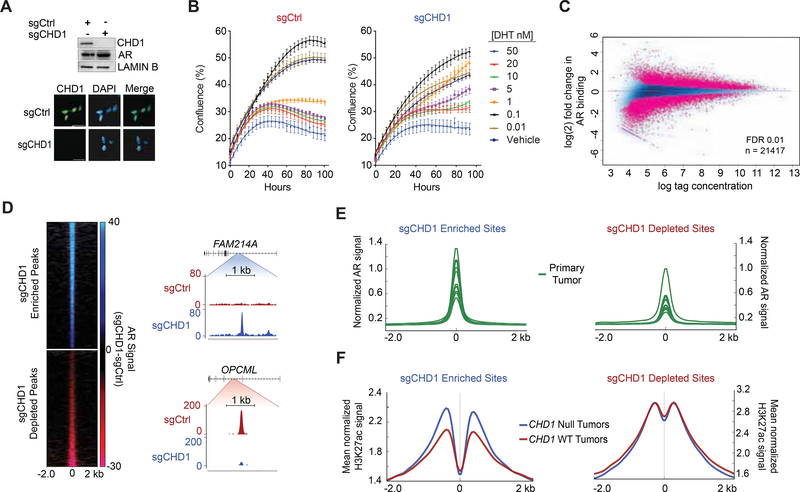
Figure 5.
AR binding is redistributed in the absence of CHD1. (A) Immunoblot (top) and immunofluorescence (bottom) of LNCaP CRISPR-Cas9 cell lines with Ctrl or CHD1 specific sgRNA. Scale bar 20 μm. (B) Growth curve of sgCtrl (left) and sgCHD1 cells (right) in response to increasing doses of dihydrotestosterone (DHT). Data represents +/− SEM. (C) ChIP Seq of differential AR binding between sgCtrl and sgCHD1. (D) RPKM normalized AR signal (sgCtrl signal subtracted from sgCHD1 signal) at sites enriched or depleted with CHD1 loss (left) and snapshots of sgCHD1 enriched and depleted AR peaks (right). (E) AR ChIP Seq from (GSE70079 (Pomerantz et al., 2015)) patient tumors centered at sgCHD1 enriched and depleted sites. (F) H3K27ac ChIP Seq from annotated primary PCa tumors (ERR3 59744 (Kron et al., 2017)) binned into CHD1 null and CHD1 WT categories. Average signal is plotted at sgCHD1 enriched and depleted sites. See also Figures S4 and S5.

