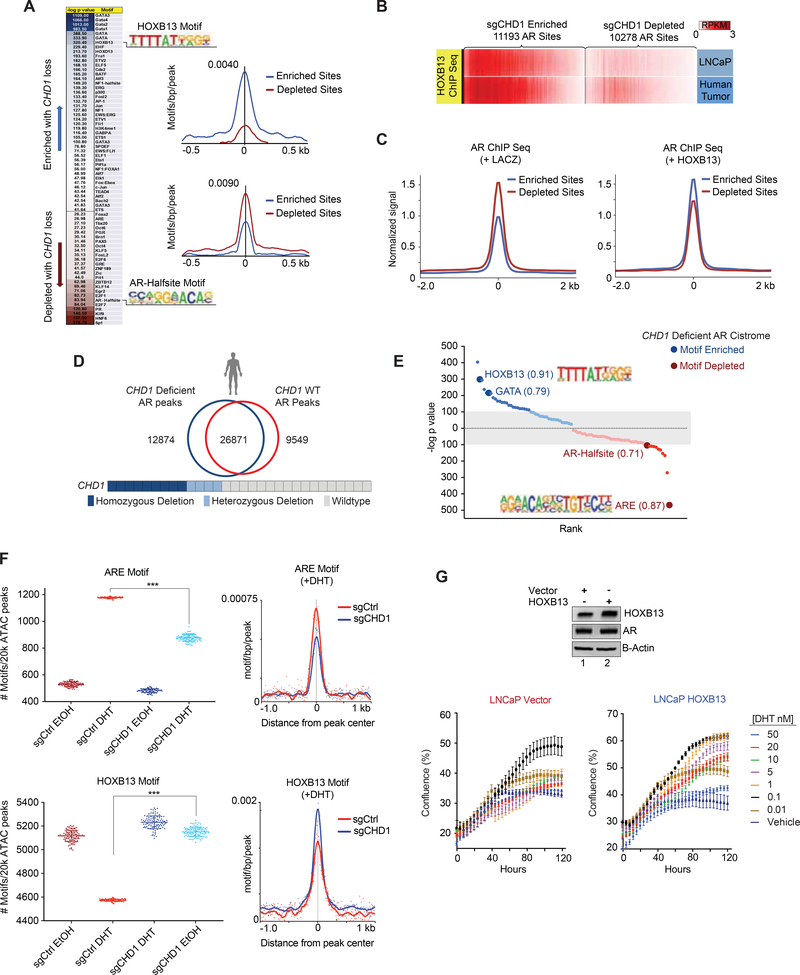
Figure 6.
AR is enriched at HOXB13 sites in CHD1 null tumors. (A) Heatmap of differential motif enrichment between sgCHD1 enriched and depleted sites (left) and histogram of the average incidence of the HOXB13 (top) and AR-Halfsite (bottom) motifs from the peak center (right). (B) ChIP-seq for HOXB13 derived from LNCaP and primary human PCa (GSE70079 (Pomerantz et al., 2015)), was plotted at sgCHD1 enriched and depleted AR sites. (C) Average ChIP-seq signal for AR in control (left) and HOXB13 expressing (right) LHSAR cells at sgCHD1 enriched and depleted AR sites (GSE70079 (Pomerantz et al., 2015)). (D) AR ChIP Seq peaks from primary human prostate tumors (Stelloo et al., 2018b) binned into CHD1 deficient and CHD1 WT categories, merged, and assessed for overlap. (E) De novo motif analysis for CHD1 deficient tumor peaks (compared to CHD1 WT tumors) and enriched (blue) and de-enriched (red) motifs plotted according to rank and p value. Values next to motifs represent the best match motif score (out of 1). Gray indicates motifs with less significant p values. (F) ATAC-seq in the sgCHD1 isogenic model +/− 4 hr of DHT. 20k peaks/condition were randomly assessed for ARE and HOXB13 motif enrichment 100x. Plotted are the number of ARE (top) and HOXB13 (bottom) motifs per 20k peaks (left) and histogram of mean ARE and HOXB13 motif enrichments under DHT conditions (right). Data represent +/− SEM. (G) Immunoblot of LNCaP cells expressing HOXB13 or vector (left) and cell growth in androgen-depleted media in response to DHT (bottom). Data represent +/− SEM. See also Figure S6 and Table S3.

