Table 1.
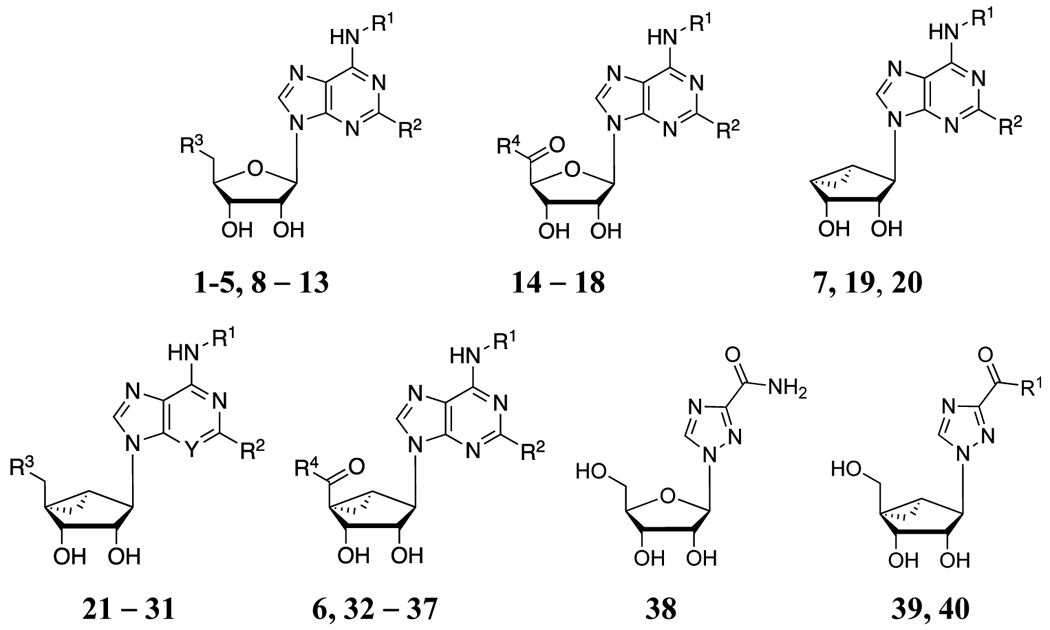
Structures and binding affinitiesa of AR ligands in the species indicated, including reference compounds 1 - 7 and 15 - 18. R3 = OH, R4 = NHCH3, Y = N, unless noted.
 | ||||||
|---|---|---|---|---|---|---|
| Compd. (other changes) |
R1 | R2 | A1AR % inhibition or Ki (nM)a |
A2AAR % inhibitiona |
A3AR % inhibition or Ki (nM)a |
Off-target, receptor (h, unless noted) (Ki, μM)a |
| Ribosides, 5′-OH or 5′-Cl | ||||||
| 1ac,d | 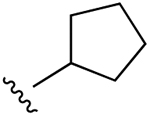 |
H | 2.3 (h), 0.22±0.01 (m) |
794 (h), 808±89 (m) |
72±12 (h), 534±14 (m) |
ND |
| 2c,d | 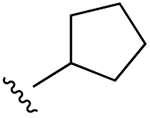 |
Cl | 0.83 (h), 0.21±0.10 (m) |
2270 (h), 988 (m) |
38±6 (h), 17±5 (m) |
ND |
| 5f (R3 = S-(2-F)-Ph) | 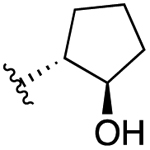 |
H | 12 (h) | >10,000 (h) | >1000 (h) | ND |
| 8b | 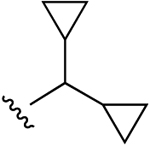 |
H | 0.85±0.27 (h), 0.8 (r) |
1470±380 (h), 1370 (r) |
41.3±5.3 (h) | none |
| 9 | 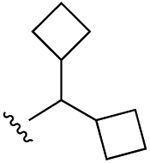 |
H | 2.14±0.52 (h), 0.37±0.02 (m) |
3550±440 (h) | 10,600±1400 (h), 897±45 (m) |
DAT 1.78, NET 4.82 |
| 10 (R3 = Cl) | 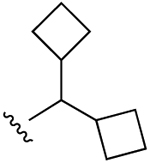 |
H | 4.90±0.87 (h), 0.71±0.12 (m) |
5200i (h) | 16,600±2000 (h), 2110±50 (m) |
TSPO 3.98, σ1 0.69, σ2 0.662 |
| 11 (R3 = SCH2CH3) | 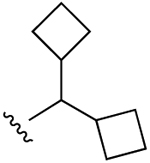 |
H | 63.4±12.1 (h), 3.58±0.01 (m) |
30±5% (h) | 6220±1480 (h), 718±150 (m) |
TSPO (90% inhib.j) σ1 0.626, σ2 0.642 |
| 12 | 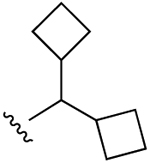 |
Cl | 17.8±8.7 (h), 0.65±0.06 (m) |
2550±540 (h) | 13,200±2500 (h), 653±85 (m) |
5HT2C 1.45 |
| 3c,d | 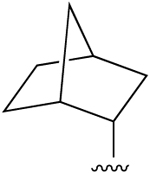 |
H | 0.38±0.19 (h), 0.34 (r), 0.14±0.02 (m) |
>10,000 (h), 477 (r) |
915±299 (h), 282 (r), 424±41 (m) |
ND |
| 4c (R3 = Cl) |
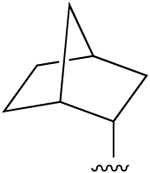 (±) (±) |
H | 0.51 (h), 0.20±0.01 (m) |
1340 (h), 3990±360 (m) |
1290 (h), 2410±330 (m) |
ND |
| 13c (R3 = Cl) | 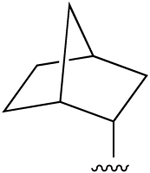 |
H | 0.76±0.42 (h) | 2050±570 (h) | 355±117 (h), 1560±140 (m) |
σ1 0.484, σ2 0.432, 5HT7 1.24 |
| Ribosides, 4′-carbonyl derivatives | ||||||
| 14 (R4 = OH) | H | H | 24±4% (h) | 11±4% (h) | 32±9% (h) | BZP (r) 7.34, σ1 1.48, σ2 0.796 |
| 15d (R3 = NH-Me) | H | H | 36.7±9.4 (h), 84 (r) |
466±95 (h), 67 (r) |
24.4±7.9 (h), 63 (r) |
none |
| 16c,d,h (R4 = NH-Et) | H | H | 6.8±2.4 (h),g 3.00±0.10 (h), 0.45±0.13 (m), 63 (r) |
2.2±0.6 (h),g 35.0±14.0 (h), 12 (r) |
35±12 (h), 14.1±6.8 (m), 113 (r) |
none |
| 17d (R4 = NH-cPr) | H | H | 1.90±0.60 (h), 6.4 (r) |
50±10 (h), 13.4 (r) |
180±50 (h), 1600 (r) |
H1 7.88, σ1 4.12 (gp), σ2 4.35 |
| 18d,h (R4 = NH-(CH2)2OH) | H | H | 12.8±3.1 (h) | 505±30 (h) | 9450±1760 (h) | ND |
| (N)-Methanocarba, 4′-truncated | ||||||
| 7c | 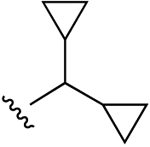 |
Cl | 47.9±10.5 (h), 5.20±0.05 (m) |
3950±410 (h), 34±9% (m) |
470±15 (h), 1060±250 (m) |
5HT2B 0.641, 5HT2C 1.85 |
| 19 | 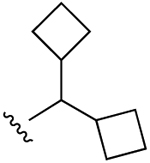 |
Cl | 961±639 (h) | 46±6% (h) | 822±449 (h), 385±52 (m) |
5HT2B 2.90, 5HT2C 8.32, α2A 6.96, TSPO 2.38 |
| 20b | 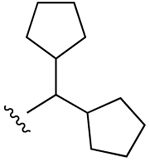 |
Cl | 34±3% (h) | 13±3% (h) | 48±2% (h) | 5HT2C 2.92, σ1 5.09, σ2 2.01 |
| (N)-Methanocarba, 5′-OH or 5′-Cl | ||||||
| 21b | H | Cl | 105±63 (h), 273 (r)b |
3420±270 (h), 1910 (r)b | 353±54 (h)d | none |
| 22 (R3= Cl) | H | Cl | 7.61±0.73 (h) | 1750±290 (h) | 253±148 (h) | σ1 1.97, σ2 2.55 |
| 23b | 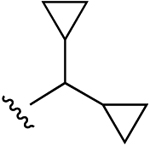 |
Cl | 39±17 (h), 0.71±0.06 (m) |
2200 (h), 41±9% (m) |
1600±210 (h), 1030±40 (m) |
5HT2B 0.641, 5HT2C 1.85, DAT 4.75 |
| 24 | 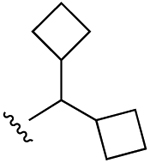 |
H | 22.7±3.0 (h), 0.53±0.19 (m) |
34±1% (h) |
51±6% (h), 918±21 (m) |
BZP (r) 4.08, 5HT2B 0.214, 5HT2C 1.32, σ1 1.79, σ2 0.753 |
| 25 | 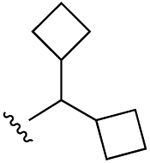 |
Cl | 8.96±1.02 (h), 2.47±0.26 (m) |
55±5% (h), 26±3% (m) |
25±2% (h), 612±58 (m) |
5HT2B 0.153, 5HT2C 0.238, M5 3.00, DAT 4.75 TSPO 2.93 |
| 26 (R3 = Cl) | 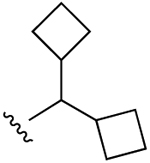 |
H | 32.7±12.4 (h), 1.05±0.19 (m) |
38±3% (h) |
49±4% (h), 934±18 (m) |
5HT2B 2.01, α2A 6.80, σ1 1.50, σ2 1.17, TSPO, 2.02 |
| 27 (R3 = Cl) | 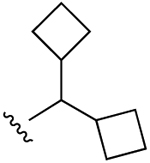 |
Cl | 120±23 (h), 11.2±0.8 (m) |
17±24% (h), 20±3% (m) |
3820±1820 (h), 1560±60 (m) |
5HT2B 1.52, 5HT2C 1.75, H2 2.60, σ2 0.349, TSPO, 2.89 |
| 28 (R3 = S-(2-F)-Ph) | 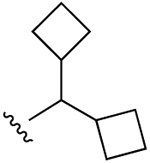 |
Cl |
45±4% (h), 2490±280 (m) |
22±5% (h), 20±9% (m) |
9750±4030 (h), 7440±660 (m) |
5HT2B 0.334, 5HT2C 1.46, σ2 0.583 |
| 29 | 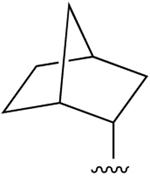 |
Cl | 23.6±5.2 (h), 1.05±0.03 (m) |
4260i (h), 15±2% (m) |
288±54 (h), 574±23 (m) |
5HT2B 0.472, NET 5.74 |
| 30 (Y = CH) | 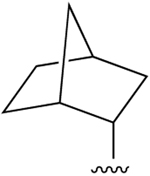 |
Cl | 240±19 (h) | 29±3% (h) | 145±74 (h) | none |
| 31 (R3 = Cl) | 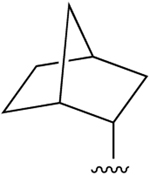 |
Cl | 44.8±1.3 (h), 1.86±0.10 (m) |
54±8% (h), 15±1% (m) |
456±201 (h), 503±13 (m) |
none |
| (N)-Methanocarba, 5′-carbonyl | ||||||
| 32b (R4 = O-Et) | 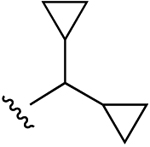 |
Cl | 360±74 (h) | 1570±180 (h) | 236±41 (h) | 5HT2B 0.015, 5HT2C 0.054, TSPO 2.50 |
| 33 (R4 = O-Et, 2′,3′-C(CH3)2) | 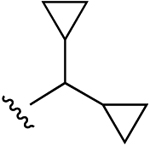 |
Cl | 49±9% (h) | 15±2% (h) | 41±6% (h) | 5HT5A 8.69, H2 6.38 |
| 34b (R4 = NH-Me) | 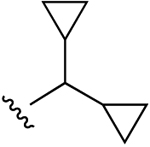 |
Cl | 110±14 (h) | 4320±870 (h) | 34±11 (h) | 5HT2B 0.023, 5HT2C 0.749 |
| 35 (R4 = O-Et) | 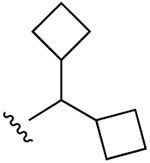 |
Cl | 73.8±14.2 (h) | 57±12% (h) | 1160±300 (h) | 5HT2B 0.097, 5HT2C 0.089, M3 5.90, σ2 2.02 |
| 6e (R4 = NH-Me) | 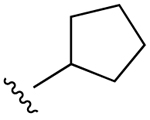 |
Cl | 18.3±6.3 (h), 0.68±0.02 (m) |
3250±300 (h) | 3.7±0.9 (h), 5.8±1.6 (r), 3.46±0.13 (m) |
5HT2B 0.012, σ1 1.55 |
| 36 (R4 = NH-cPr) | 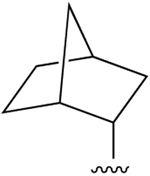 |
Cl | 1.22±0.05 (h), 0.45±0.03 (m) |
520±119 (h), 2650±560 (m) |
59.0±17.8 (h), 29.5±0.6 (m) |
5HT2B 1.57 |
| 37 (R4 = NH-(CH2)2OH) | 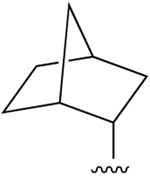 |
Cl | 17.6±5.3 (h), 1.56±0.09 (m) |
5400i (h), 23±1% (m) |
127±29 (h), 447±43 (m) |
5HT2B 0.718, KOR, 2.63 |
| Ribavirin analogues | ||||||
| 38g | - | - | 7410±100 (h), 4430±460 (m) |
23±6% (h) |
16±5% (h), 0% (m) |
ND |
| 39 | OCH3 | - |
6±4% (h), 2990±80 (m) |
14±5% (h) |
22±4% (h), 15±2% (m) |
β3 1.42, H3 4.52, σ2 1.72 |
| 40 | NH2 | - | 495±35 (h), 25.2±2.8 (m) |
11±3% (h) |
41±6% (h), 47±2% (m) |
5HT2B 1.91, 5HT2C 2.35, DAT 6.61, σ2 2.09 |
Binding in membranes of CHO or HEK293 (A2A only) cells stably expressing one of three hAR subtypes, unless noted (n = 3–5). The binding affinity for hA1, A2A and A3ARs was expressed as Ki values using agonists [3H]N6-R-phenylisopropyladenosine 51, [3H]2-[p-(2-carboxyethyl)phenyl-ethylamino]-5′-N-ethylcarboxamidoadenosine 52, or [125I]N6-(4-amino-3-iodobenzyl)adenosine-5′-N-methyluronamide 53, respectively. A percent in italics refers to inhibition of binding at 10 μM. Nonspecific binding was determined using adenosine 5′-N-ethyluronamide 54 (10 μM). Values are expressed as the mean ± SEM (n = 3, unless noted). Ki values were calculated as reported.42 Off-target interactions determined by the PDSP. Receptor abbreviations are defined in the Supporting Information. Gp, guinea pig.
Data from Jacobson et al.32
Functional EC50 (nM) at hA2BAR: 16, 140±19; 18, 948±38.44
n = 1.
Percent inhibition at 10 μM.
ND, not determined.
