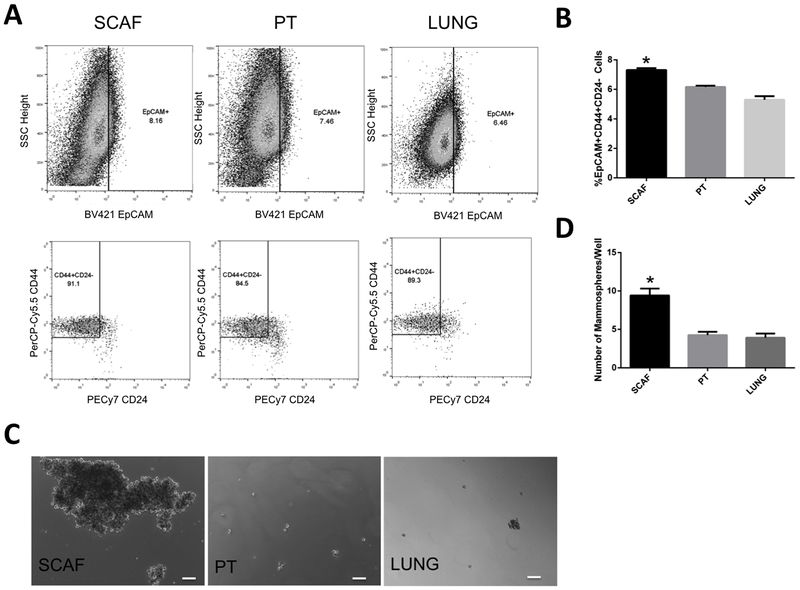
Figure 4: Scaffold-captured tumor cell line shows higher proportion of cancer stem cell like cells.
(A) Representative flow plots for SCAF, PT, and LUNG cell lines.(B) Percentage of EpCAM+CD44+CD24- cancer stem cells (n=3 distinct samples per condition).(C) Representative images of mammospheres from SCAF, PT, and LUNG cell lines.(D) Number of mammospheres per well for each cell line. (n=12 distinct samples per condition). Error bars represent s.e.m. *p<0.01 relative to PT, and LUNG lines via two tailed t-test.

