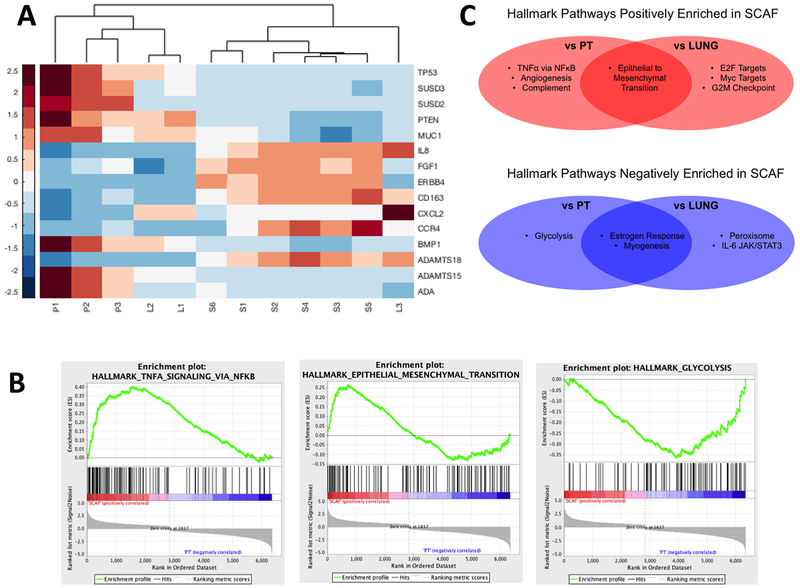
Figure 5: Scaffold-captured tumor cell line shows distinct transcriptome from PT and similar to LUNG by RNAseq.
(A) Heat map with unsupervised hierarchical clustering of top differentially expressed genes for SCAF (S1-S6), PT (P1-P3), and LUNG (L1-L3) demonstrating SCAF cells have a distinct transcriptome relative to LUNG and PT but cluster more closely with LUNG than PT.(B) Gene set enrichment analysis (GSEA) enrichment plots for pathways altered in SCAF transcriptome relative to PT (C) Gene set enrichment analysis for Hallmark pathways positively enriched in SCAF vs PT and SCAF vs LUNG (red) and negatively enriched in SCAF vs PT and SCAF vs LUNG (blue) (false discovery rate q-value <0.25 and p-value <0.05).

