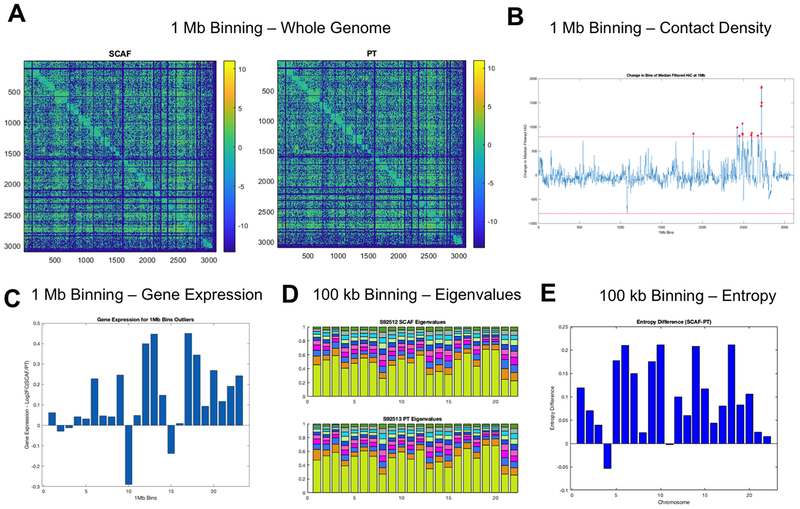
Figure 6: SCAF tumor cells show distinct genome structure identified by Hi-C.
(A) Hi-C contact matrices for SCAF and PT cells at 1 Mb binning.(B) Contact density difference (SCAF-PT) for each 1 Mb bin calculated by summing the counts for each bin in one dimension. Bins with a value more than 4 standard deviations above the mean were identified as altered in structure and starred in red.(C) Log2 fold change in gene expression for SCAF/PT plotted for each of the altered bins identified in B. For identified bins with higher counts for SCAF, most have a corresponding higher gene expression.(D) Eigenvalue decomposition of 100 kb Hi-C matrices for each chromosome showing subtle differences in the eigenvalues for both samples.(E) Entropy difference for SCAF - PT calculated for each chromosome at 100 kb resolution.

