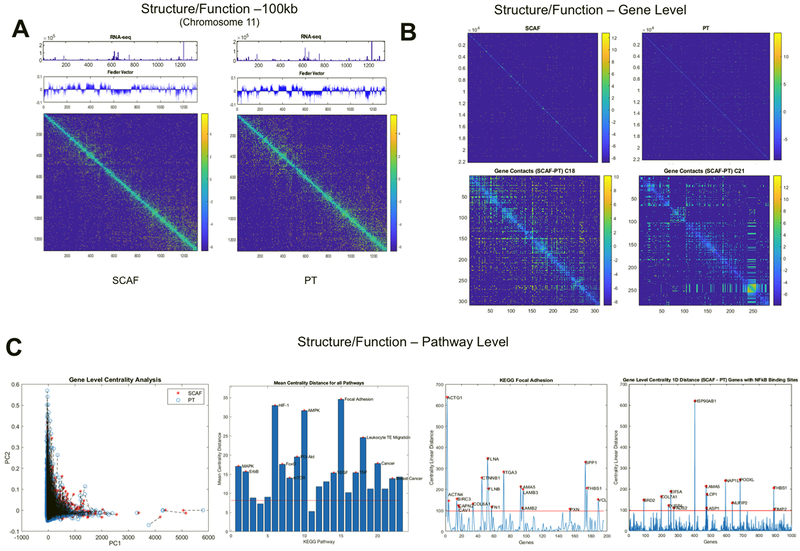
Figure 7: SCAF cells demonstrate differential structure and function relationships from PT cells.
Structure (Hi-C matrix and corresponding Fielder Vector) and function (RNAseq) investigated at the 100kB level for Chromosome 11(A). Structure relationships for the whole genome (top) for SCAF and PT and differences in gene level contacts for chromosome 18 and 21 visualized as the SCAF matrix – PT matrix (bottom)(B). Gene level centrality analysis for the whole genome comparing structure/function for SCAF and PT pairs for each gene connected by dashed black line(C). KEGG pathways investigated for difference in centrality distance from SCAF to PT for genes in a given pathway, red stars indicate pathways that are significantly different from the mean genome-wide centrality distance by two tailed t-test. Centrality distance for SCAF – PT calculated for KEGG Focal Adhesion Pathway and for genes with NFkB binding sites. Red stars indicate genes that are more than four standard deviations above the genome-wide mean centrality distance.

