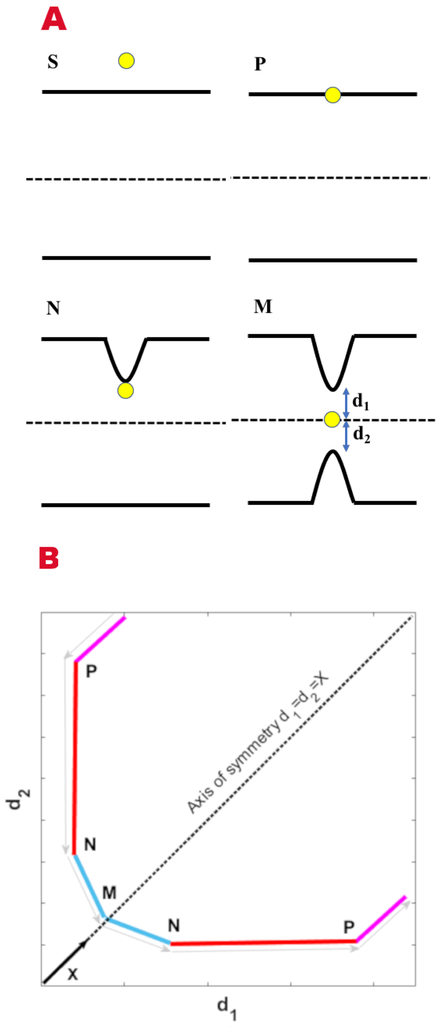
Fig 2.
A) A schematic representation of ion permeation through a membrane using the new coarse variables. The permeation process starts at point S in solution and continues to point P where the ion, “touching” the membrane, has the shortest distance to a phosphate group. The ion drags the phosphate group into the membrane to reach point N. At point N the ion starts interacting with the lower membrane and pulls a phosphate group from it. At the same time the interaction with the upper phosphate weaken slightly. The last step brings the ion to the transition state M where the ion has the same minimal distance to the phosphate groups at each leaflet and d1=d2. B) Schematic representation of the points mentioned in panel A in the space of the two coarse variables d1 and d2. The black vector points along X that starts at origin (d1=d2=0) and defines the axis of symmetry and transition line.

