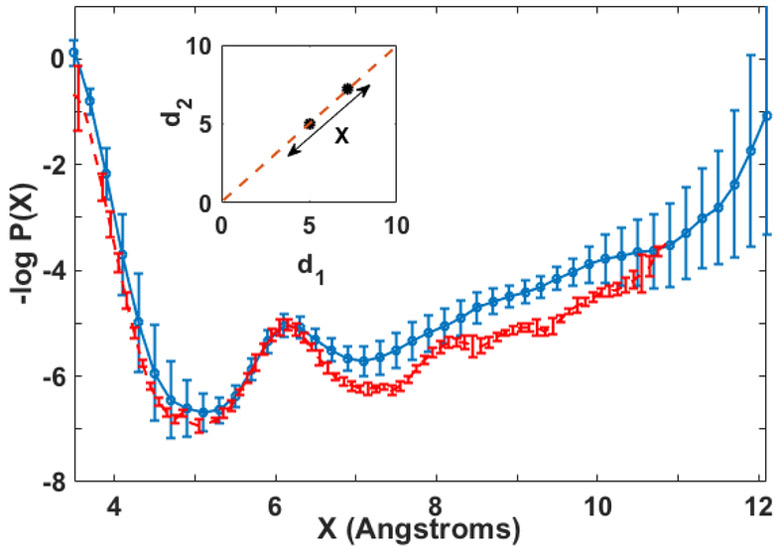
Fig 4.
The free energy change along the transition line d1=d2=X obtained from (i) long MD trajectories with system confined to stay along the axis of symmetry (blue) and (ii) umbrella sampling (red). Both plots are similar, which adds confidence in the convergence of the calculation. The two saddle points are located at X=5Å and X=7.2Å.

