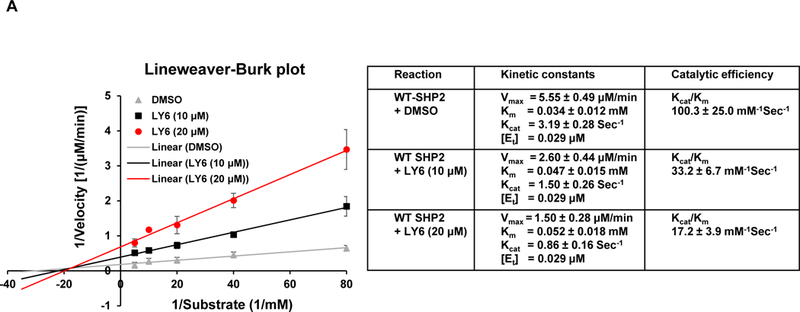
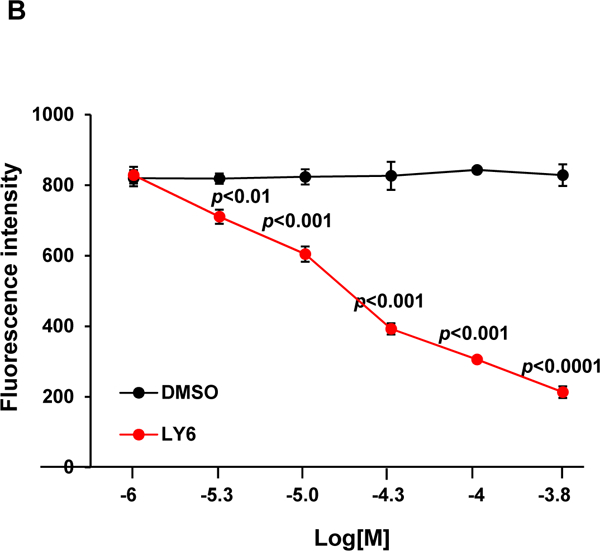
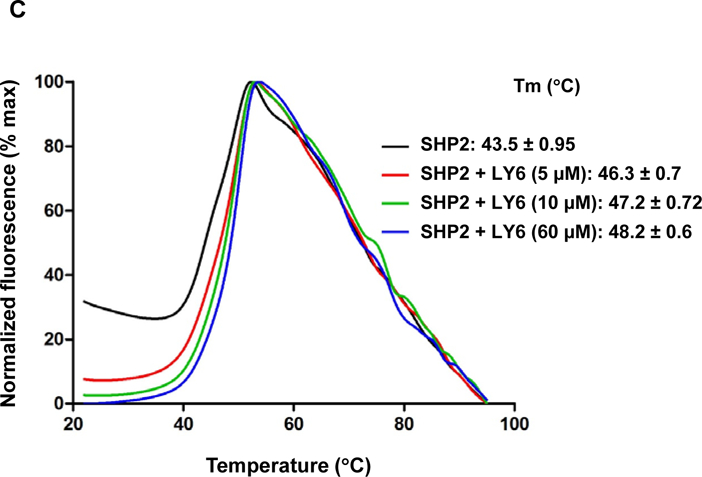
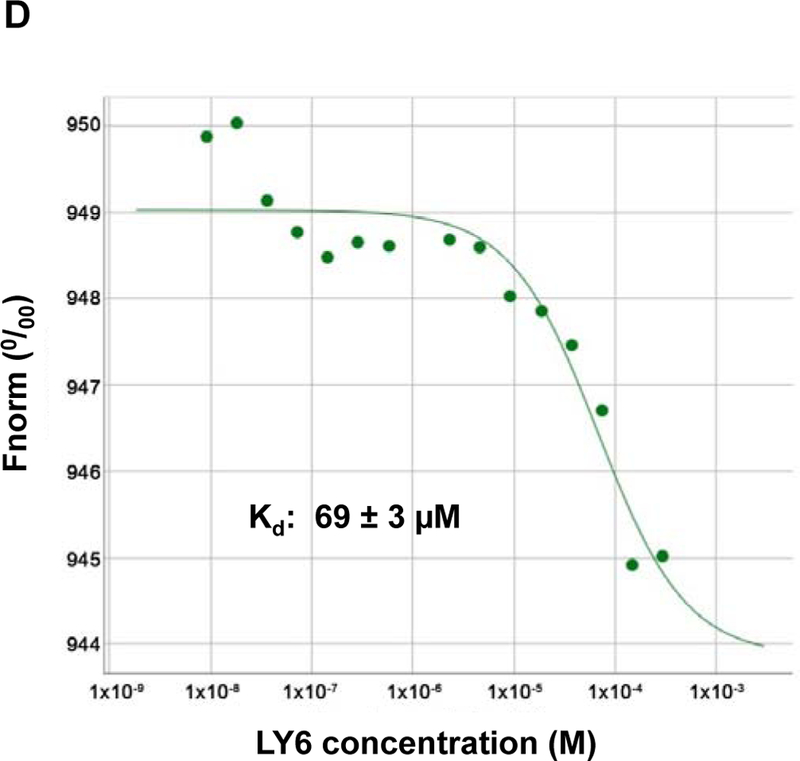
Figure 3. 1 directly binds to the SHP2 protein and functions as an inhibitor.


(A) Enzymatic kinetic analyses in the presence or absence of 1 were performed using full length WT SHP2 (0.1 µg) as the enzyme. 1 concentrations used in this experiment were 0, 10, and 20 μM. Lineweaver-Burk plot was generated to show 1-mediated SHP2 inhibition. Experiments were repeated independently three times. Results shown are the mean ± SD of three independent experiments. (B) Fluorescence titration of SHP2 was performed by increasing the concentrations of 1 while maintaining the WT SHP2 protein concentration at 3.0 µM. The fluorescence intensity is plotted against the log concentration in mol/L (Log[M]). Experiments were repeated independently three times, similar results were obtained in each experiment. Data shown are the mean ± SD of triplicates from one representative experiment. (C) Thermal shift assays were performed as described in Experimental Section. Representative dose response melting curves of His-tagged SHP2 in the presence of 1 are shown. Tm data shown are the mean ± SD of three independent experiments. (D) MST binding affinity assays were performed as described in Experimental Section. One representative dose-response curve of 1 binding to His-tagged SHP2 is shown. Fnorm, normalized fluorescence. Experiments were repeated independently three times. Reported Kd is the mean ± SD of three independent experiments.
