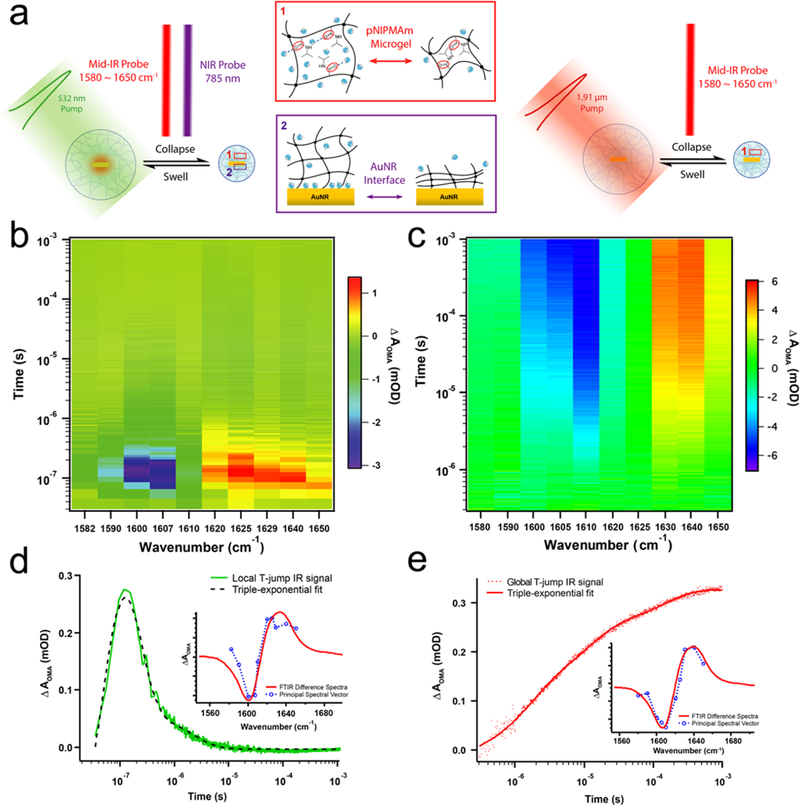
Figure 3.

OMA actuation dynamics triggered by local and global T-jump measured by time-resolved IR spectroscopy. (a) Schematic illustration of pump−probe IR measurement of OMA actuation triggered by local and global T-jump. (b) Time-resolved IR spectral image of OMA triggered by local T-jump. (c) Time-resolved IR spectral image of OMA triggered by global T-jump. (d) The kinetic and spectral components of local T-jump IR spectral image. (e) The kinetic and spectral components of global T-jump IR spectral image.
