
Figure 5.
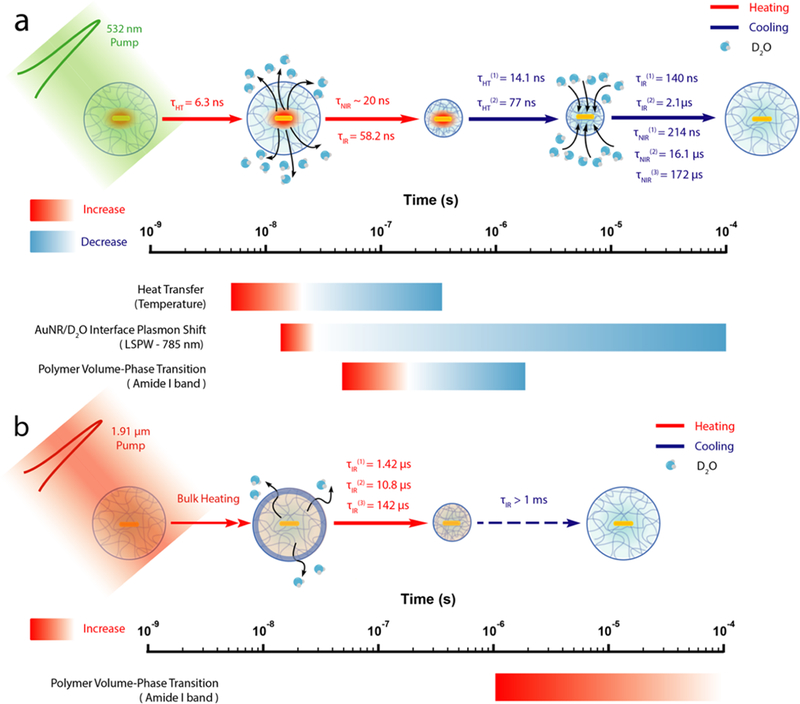
Schematic representation of OMA actuation dynamics and subsequent events on the logarithmic time scale. (a) Local T-jump triggered OMA actuation dynamics and corresponding heating and cooling events shown on the logarithmic time scale. (b) Global T-jump triggered OMA actuation dynamics and corresponding heating and cooling events shown on the logarithmic time scale.