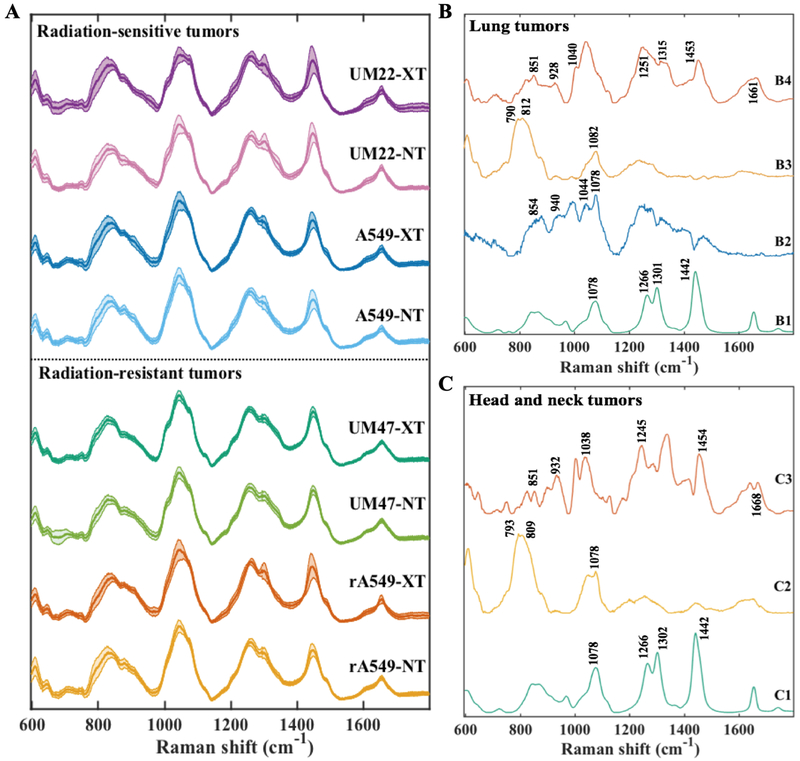
Figure 2. Raman spectra of radiation-resistant and sensitive tumors.
(A) Mean Raman spectra (with the shadow representing 1 standard deviation) acquired from lung tumors derived from parental A549 and radiation-resistant (rA549) cells and head and neck tumors derived from radiation-sensitive UM-SCC-22B and radiation-resistant UM-SCC-47 cells. Each of the types were either exposed to fractionated radiation (XT) or sham radiation (NT). (B) A subset of relevant MCR loading vectors derived from the spectra of lung tumors belonging to all the four study classes. The spectra B1 through B4 represent lipid-rich, glycogen-rich, nucleic acid-rich and collagen-rich loadings, respectively. (C) A subset of relevant MCR loading vectors derived from the spectra of tumors belonging to head and neck tumor dataset. The spectra C1 through C3 represent lipid-rich, nucleic acid-rich and collagen-rich loadings, respectively.

