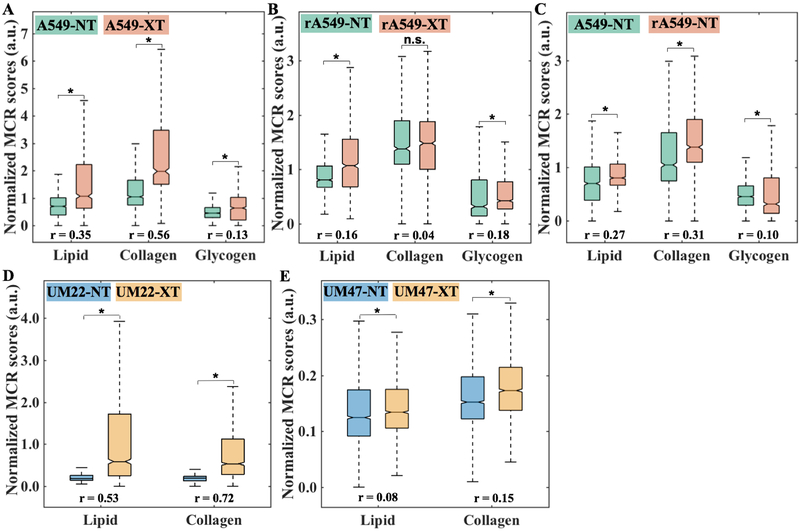
Figure 4. Quantitative MCR-ALS analysis of Raman spectra.
(A-C) Boxplots of normalized scores of lipid-rich, collagen-rich and glycogen-rich MCR-ALS loadings showing radiation induced differences in sensitive lung tumors (A549-NT vs A549-XT), radiation induced differences in resistant lung tumors (rA549-NT vs rA549-XT) and pre-radiation differences between sensitive and resistant lung tumors (A549-NT vs rA549-NT), respectively. The differences in the scores of lipid and glycogen loadings are statistically significant (indicated by * and n.s. otherwise) at p < 0.001 level (Wilcoxon rank sum test) for each of the three comparisons (A-C), whereas the differences in the scores of collagen loadings are statistically significant only for the comparisons in (A) and (C). (D-E) Boxplots of normalized scores of lipid-rich and collagen-rich MCR-ALS loadings showing radiation induced differences in sensitive head and neck tumors (UM22-NT vs UM22-XT) and radiation induced differences in resistant head and neck tumors (UM47-NT vs UM47-XT), respectively. The differences in the scores of lipid and collagen loadings are statistically significant (indicated by *) at p < 0.001 level (Wilcoxon rank sum test) for both the comparisons. The effect size (r), characterizing magnitude of differences between groups, is provided for each comparison.

