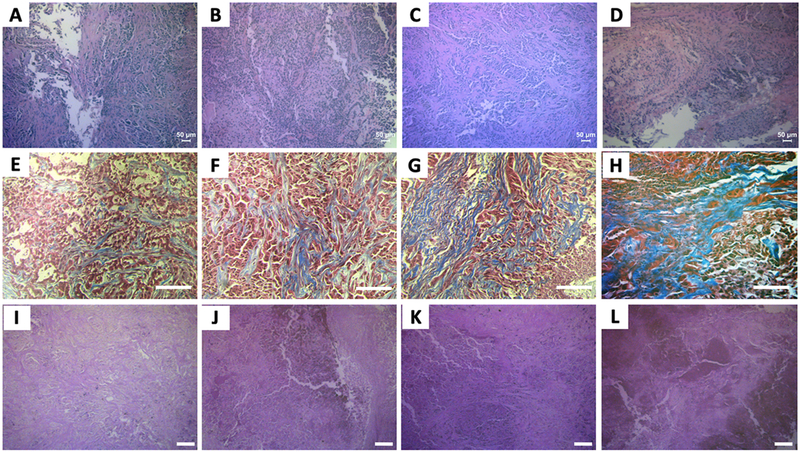
Figure 5. Histologic assessment of radiation sensitivity and resistance.
Top (A–D), middle (E–H) bottom (I-L) panels display representative microscopic images of H&E, Masson’s trichrome and PAS stained slides, respectively. The columns of panels from left to right - (A, E and I), (B, F and J), (C, G and K) and (D, H and L), respectively, represent fields of view from tumors belonging to the treatment groups - A549-NT, A549-XT, rA549-NT and rA549-XT. The scale bars in panels A-D represent 50 μm and panels E-L represent 100 μm.

