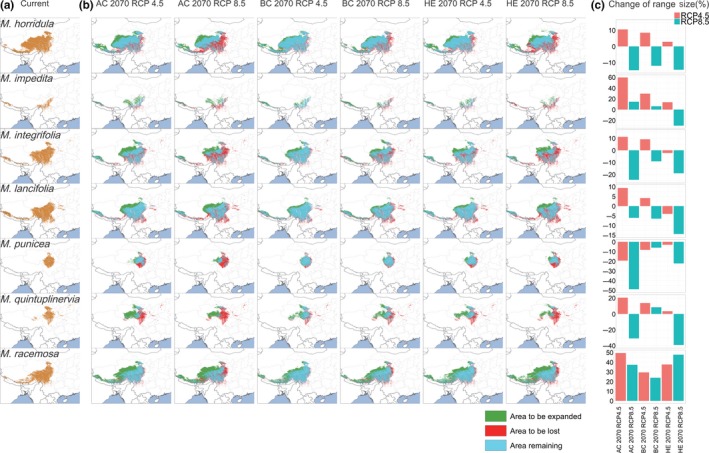
Figure 3.

Comparison of (a) the predicted distribution region for each species in the current time period; (b) and the overlay of the current time period and the year 2070 for ACCESS1‐0 (AC), BCC‐CSM1‐1 (BC), and HadGEM2‐ES (HE) models under RCP 4.5 and RCP 8.5 scenarios, with green region showing the new area to be colonized, blue region showing the area remained still, and red region showing the area to be lost; (c) changes of range size (%) for every species’ six models
